The Current State of DevSecOps Metrics

PUBLISHED IN
Continuous Deployment of CapabilityIn the BBC documentary series Connections, science historian James Burke traced how technical innovations build on one another over time. New capabilities create new possibilities, new challenges, and new needs. This pattern also applies to the evolution of software engineering, where changes in software engineering practices are often driven by changes in underlying technologies. For example, the practice of frequent compiling and testing of code was a legacy of the post-punch card era in the 1980s. When dedicated desktop compilers increased the convenience of compilation, it became easier for engineers to compile and test more frequently, which then became a common practice.
This evolution continues today in the practices we associate with DevSecOps, such as continuous integration (CI), continuous delivery/deployment (CD), and infrastructure as code, all of which are made possible by improvements in underlying technology that automate the development-to-production pipeline. These DevSecOps practices will potentially generate more information about development and operational performance than has ever been readily available before. In this blog post, I discuss the ways in which DevSecOps practices yield valuable information about software performance that is likely to lead to innovations in software engineering metrics.
Data Generated by DevSecOps Practices
DevSecOps replaces practices that in the past have been labor-intensive and error-prone. CI is the automated process by which developers integrate code then build, test, and validate new applications. Its success was not practical until compilers (and the underlying compute hardware) evolved to be able to compile code quickly. Also needed were robust version control, configuration management, and test suites.
CD is the automated process of creating releasable artifacts. Its success depends on the ability of today's tools to automate not only the building of programs, but execution of system tests and delivery of validated code into production. Infrastructure as code—the scripting or virtualization of infrastructure that replicates the operational environment and optimizes computing resources—depends on the availability of encapsulated virtual environments, another recent technological innovation.
The automation that makes these DevSecOps practices possible in turn spawns a large amount of data as a by-product. This data can be made available to enable stakeholders to assess the health of a project including its development performance, operational performance, whether it is sufficiently secure, and how frequently upgrades are being delivered.
What Are Metrics, and Why Do We Need Them?
Software metrics enable stakeholders in the development of software—developers, security personnel, operations personnel, development teams, and executives—to know key things they need to know about software projects, answering such questions as the following:
- Is the service delivering value to the users?
- Is the service operating properly?
- Is the organization achieving its business goals?
- Is the service secure?
- Is the infrastructure able to support throughput, memory constraints, and other requirements?
- Is the service being attacked?
- Can future needs be supported?
- What will be the cost and risk of adding new features?
Data that is generated by the DevSecOps methodology can help provide answers to these and similar questions.
Metrics are measurements of system properties or performance that inform decisions. They can be used to understand what happened or what might happen in the future. They help to determine such things as
- if the process is stable
- if the process is capable
- if goals are being met
- how alternative processes, tools, or products compare
- how to manage change
Limitations of Existing DevSecOps Metrics
Studies have identified four key metrics that support software development and delivery performance. Two relate to tempo and two to stability.
Tempo
- deployment frequency
- lead time from commit to deploy
Stability
- mean time to recover from downtime (mean time to restore [MTTR)]) or mean time between failures (MTBF)
- change failure rate or percentage
In our work with customers on DevSecOps, we have observed that focusing only on the tempo and stability metrics can result in an accumulation of technical debt and insufficient security and operations practices.
The U.S. General Services Administration (GSA) provides a larger set of metrics to measure success at implementing DevSecOps. The table below lists the GSA’s set of high-value DevSecOps metrics. These include the above four key metrics.
| Metric | Description | Associated Domain |
|---|---|---|
| Deployment frequency | Number of deployments to production in a given time frame | Associated deployment; authority to operate (ATO) processes |
| Change lead time (for applications) | Time between a code commit and production | Overarching; ATO processes; patch management |
| Change volume (for applications) | Number of user stories deployed in a given time frame | Overarching |
| Change failure rate | Percentage of production deployments that failed | Application development |
| MTTR (for applications) | Time between a failed production deployment and full restoration of production operations | Application deployment; backup and data lifecycle management; patch management |
| Availability | Amount of uptime/downtime in a given time period, in accordance with the service-level agreement | Availability and performance management; network management |
| Customer issue volume | Number of issues reported by customers in a given time period | Overarching |
| Customer issue resolution time | Mean time to resolve a customer-reported issue | Overarching |
| Time to value | Time between a feature request (user story creation) and realization of business value from that feature | Overarching; ATO processes |
| Time to ATO | Time between the beginning of Sprint 0 to achieving an ATO | Overarching; ATO processes |
| Time to patch vulnerabilities | Time between identification of a vulnerability in the platform or application and successful production deployment of a patch | ATO processes |
Table 1: GSA-Proposed DevSecOps Metrics
While the metrics in Table 1 are more balanced and holistic than the tempo and stability metrics, many don’t satisfy the characteristics of a good metric. For example, what does “Time to authority to operate (ATO)” tell us? A program needs to achieve ATO only once, then maintain it. Knowing how long it took to initially achieve an ATO does not form the basis for improvement or answer any worthwhile improvement question. Time to value is also problematic. To begin, what is the definition of an Agile user story? How is it consistently applied across multiple teams within a large system-development pipeline? When does time start? And can we automate the data collection and reporting?
A notable limitation of all these metrics is that they measure either operations or development results rather than the process. Today’s metrics are based largely on development lead times and operations (e.g., deployment rate, MTTR). They have not instrumented and analyzed the DevSecOps stack to the extent that is now possible. The most popular metrics are DORA (DevOps Research and Assessments) metrics, developed by Nicole Forsgren in the book Accelerate. However, DORA metrics are (1) based on surveys, not direct measures, and (2) not well suited to meet DoD needs, which are characterized by complex products, multiple subcontractors, and converging DevSecOps pipelines.
We can make plausible arguments about how the metrics are synergistic or how they operate, but even where we measure the outputs directly, the results do not necessarily guide us on how to proceed. For example, what customer-resolution time is acceptable? How might it be shortened? What about complex systems involving multiple pipelines? To answer these questions requires direct understanding of the development workflow with more fine-grained lead times between steps, areas causing rework, areas requiring additional resources, or better approaches.
Measurement monitors a current state and makes improvement possible, but measuring a product or process alone will not sustain or improve it. To be useful, measurements must be accessible and available and related to business goals, and they must provide value that exceeds the cost of data collection. The promise of DevSecOps for metrics is that in a DevSecOps environment, data will be available, timely, and inexpensive to acquire. Because everything is automated, it should be possible to measure automatically with DevSecOps, reducing the cost of collecting information.
Opportunities for Improving Metrics in DevSecOps
Each of the stages in the DevSecOps pipelines, shown in Figure 1, provide an opportunity to measure by looking at pieces of data that provide usable information. The pipeline can and should be instrumented for measurement by automating and timestamping logs and including relevant configuration data.
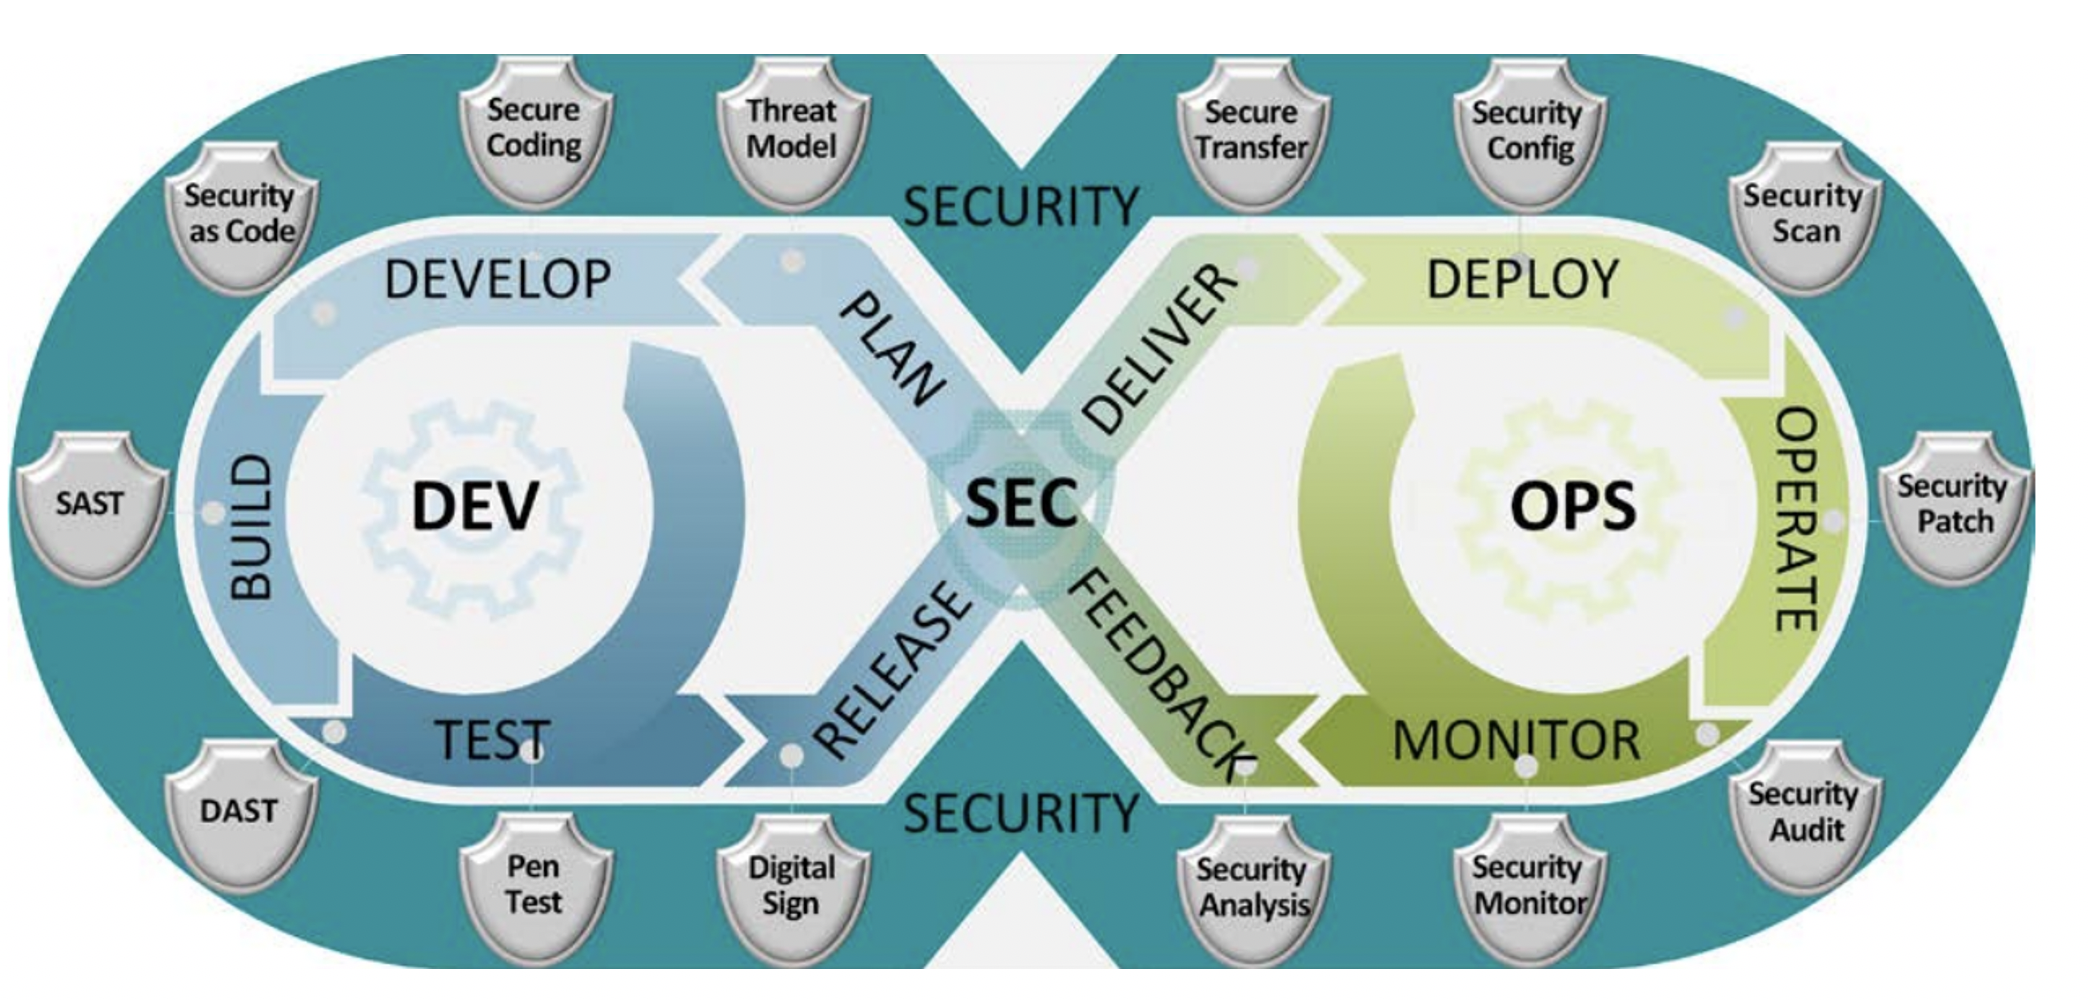
Figure 1: Stages of DevSecOps Pipelines (from DoD Enterprise DevSecOps Reference Design, Version 1.0, 12 August 2019)
The DevSecOps pipeline tracks key transitions and events, such as bug reports submitted, change requests submitted, code commitments made, builds, tests, deployment, and operating failures and recoveries. In DevSecOps, the system is continuously monitored for assurance by tracking application usage and latency, and the volume and sources of network traffic. Sources for data include
- change-request systems
- bug-tracking systems
- documentation of peer reviews
- source revision control and configuration management
- build, test, and deployment platforms (i.e., change or release management)
- static and dynamic testing tools
- outputs of the project-planning system
- application-monitoring tools
Table 2 below demonstrates what such DevSecOps instrumentation for measurement might entail.
| When | Tool | Measures (always include timestamp) |
|---|---|---|
| Change request | Change-control system | Request ID |
| Bug report | Issue/defect repository | Issue ID, description |
| Code check-in | Source revision control | Change size, changes addressed |
| Static analysis | Static-analysis tool and scripts | Volume of code, findings |
| Build | Scripts, continuous integration | Success/failure |
| Test | Scripts, test environments | Number of tests, number of failures |
| Deployment | Scripts, continuous delivery/deployment | Success/failure |
| System failure | Application performance monitoring | System downtime, logs |
Table 2: Automated Measurement-Data Sources
For the development (Dev) component of DevSecOps, instrumentation could provide a wealth of useful information. Examples include the following:
- When tools are instantiated indicates when work actually began, providing empirical evidence of adherence to plans and schedules and of their fidelity.
- The time of code check-ins indicates when reviews took place, when code was completed, and when bugs were fixed.
- When builds and integrations are executed indicates the number of times that builds were necessary to fix bugs.
- When automated tests are triggered indicates how many issues were found and resolved.
- When deployment was triggered indicates that the product is complete and ready for use.
Security (Sec) in operations could be measured by, for example, the types of evaluations performed and the weaknesses identified.
For operations (Ops), we would look at events and events over time. Use indicates value to the user. Resource limitations and failures indicate lost revenue or opportunity. Other events, such as network activity, can indicate adversarial probing for weakness or denial-of-service attacks that can be fed back into attack-surface analysis.
Key measures for DevSecOps focus on continuously monitoring the overall health of the system.
- Lead time—indicates responsiveness and will be affected by quality, productivity, and resource utilization.
- Deployment frequency—how often a new release is deployed into production.
- Availability and time to recovery—indicate reliability.
- Production failure, operational errors, and rework—indicate quality issues.
- Exploits and attacks—lagging indicator of the security of a system.
Process indicators such as these can be leading indicators that predict outcomes. When indicators suggest a problem, other metrics can be used to identify the root cause.
Further Exploration of DevSecOps Metrics
While real-time data is a key DevSecOps practice, what should be measured and what questions need to be addressed in real time are not clear. Various DevSecOps tools provide some metrics and dashboards, but the value and insight of these measures and associated dashboards vary greatly. To address the limitations of many of the current DevSecOps metrics in use, a more holistic approach is needed in which the automated nature of DevSecOps is fully utilized to collect and correlate data that can be mapped to the processes used and form a quantitative basis for improvement.
Such a holistic approach would focus first on the questions and information needs of various stakeholders throughout the DevSecOps pipeline. This approach would then develop associated metrics, or graphical representations of data, that should be available automatically using commonly used DevSecOps pipeline tools. Such an approach would allow organizations, projects, and teams to systematically identify their informational needs and to recognize which standard, readily available metrics and tools are not sufficient and require additional data to answer questions relevant to their specific needs.
In future blog posts, I will explore in greater detail and provide examples of the specific ways in which DevSecOps metrics can be used to measure productivity/throughput, reliability, quality, and security and operations.
Additional Resources
Learn more about SEI work on DevSecOps.
Read other SEI blog posts about DevOps and DevSecOps.
Read other SEI blog posts about measurement and analysis.
The Current State of DevSecOps Metrics has been published in KiltHub: https://doi.org/10.1184/R1/14346860.v1
Written By

More By The Author
More In Continuous Deployment of Capability
PUBLISHED IN
Continuous Deployment of CapabilityGet updates on our latest work.
Sign up to have the latest post sent to your inbox weekly.
Subscribe Get our RSS feedMore In Continuous Deployment of Capability
Get updates on our latest work.
Each week, our researchers write about the latest in software engineering, cybersecurity and artificial intelligence. Sign up to get the latest post sent to your inbox the day it's published.
Subscribe Get our RSS feed