Principles of Big Data Systems: You Can't Manage What You Don't Monitor

The term big data is a subject of much hype in both government and business today. Big data is variously the cause of all existing system problems and, simultaneously, the savior that will lead us to the innovative solutions and business insights of tomorrow. All this hype fuels predictions such as the one from IDC that the market for big data will reach $16.1 billion in 2014, growing six times faster than the overall information technology market, despite the fact that the "benefits of big data are not always clear today," according to IDC. From a software-engineering perspective, however, the challenges of big data are very clear, since they are driven by ever-increasing system scale and complexity. This blog post, a continuation of my last post on the four principles of building big data systems, describes how we must address one of these challenges, namely, you can't manage what you don't monitor.
The Challenges of Scale
While debate rages over the precise characteristics of a big data system, from a software-engineering perspective, the major characteristics are well understood. These characteristics revolve around the scale of applications and the inherent complexity that emerges as applications grow to manage and analyze ever-growing amounts of data. As I've written in earlier blog posts, the requirements of scalability mandate that we adopt new design and engineering approaches because many existing tenets of software engineering simply don't hold at scale.
A fundamental characteristic of big data systems is that there will be an increasing number of software and hardware failures as the scale of an application increases. Component failure, in fact, must be seen as the norm, and applications must be designed to be resilient to failures and diligently handle them to ensure continued operations. Note that software failures induced by scale may occur in application components or in third-party components integrated into the system, both open-source and commercial.
A second characteristic is that, as scale increases, so does complexity. There are more component interactions, increasingly unpredictable request loads on data collections, and increased competition for shared resources, including central processing units (CPUs) on multicore nodes, memory, cluster interconnects, and disks. This inherent complexity and non-deterministic behavior makes diagnosing aberrant behavior an immense challenge. If performance suddenly becomes a problem for particular transactions, it can be immensely time-consuming and challenging to diagnose, whether the cause lies in the transaction implementation itself or is a result of unexpected interactions with other components.
A third characteristic of big data systems is that scale makes thorough testing of big data applications before deployment both impractical and infeasible. For example, if your application will store and analyze one petabyte of data, it is probably impractical to create a test environment and test data at this scale. Moreover, even if you could test at deployment scale, as soon as your data grows, your code is operating beyond its tested tolerances. In reality, the only way to discover if your new components operate correctly is to deploy them on the production system and use techniques such as canary testing to validate their behavior.
Finally, it's important to see these challenges of failure handling, complexity, and testing in the context of contemporary big data system deployments. The scale of companies like Netflix, which uses Cassandra to manage data on 750 nodes as part of its cloud-based software infrastructure, are well documented examples that herald the future for many large government and business organizations.
Even today, there are many conventional government and business systems that require massive resources to satisfy their requirements. Here are some examples from the healthcare domain. The United Kingdom's National Health Service (NHS) Spine2 system is being initially deployed on hundreds of processors running on dozens of Linux-based commodity servers located across multiple data centers. Spine2's database contains clinical records for each of the 70 million NHS patients, and this data is requested and amended more than 2.6 billion times a year. Spine2 also connects and services more than 21,000 organizations and links over 27,000 software systems within these organizations. Ease of scalability to support information growth and high availability to support clinical care are key drivers behind the design of Spine2. Similar systems have been built to support the Danish medical records system, and, in the United States, the Military Health System stores several petabytes of patient and clinical data and integrates with a large number of external health providers.
Observability: Fundamental to Successful Big Data Systems
The term observability defines a collection of capabilities that make it possible to monitor, analyze, and proactively and reactively respond to events that occur at runtime in a big data system. As big data systems scale, it must be possible to observe and reason about changes in behavior so the system can be operated and evolved reliably. The adage "you can't manage what you don't monitor" is especially true for complex, distributed systems that have an overwhelming number of moving parts, both hardware and software, that interact with each other in many subtle and unanticipated ways.
Here's a simplified example of the problems that can arise in big data systems. Two separately developed, completely independent business transactions were providing the expected response times in operations across a horizontally partitioned database. Suddenly, one transaction slowed down, intermittently, making it occasionally non-responsive to user needs. Extensive investigations over several days, including detailed logging in production and attempts to recreate the situation in test, eventually led to identifying the root cause. Essentially, periodic and brief request spikes for one of the transactions were overloading a small number of database nodes. During these overload conditions, when the other transaction was invoked, it attempted to read data using a secondary index that is distributed across all nodes. These secondary index reads from the overloaded nodes were taking tens of seconds to respond, leading to unacceptable latencies for those transactions.
How could an observability framework have helped discover the root cause of this problem more quickly? If the developers could have analyzed performance data to visualize transaction volumes for the first transaction against latencies for the second, it would have been immediately obvious that there was a correlation. This visualization would have highlighted the areas of the code that should be investigated as the root cause of the high transaction latencies stemmed from this subtle interaction .
Of course, this type of performance data does not come for free from databases or web and applications servers. Capturing the necessary performance data to perform this type of analysis requires
- applications to be instrumented with application-relevant measures for observability
- a data collection capability to capture and store observability data
- analysis capabilities for developers and operators to gain rapid insights from observability data
By necessity, internet companies operating at immense scales have built their own observability solutions. These solutions are extensive and powerful and have been built at considerable cost specifically for each operational environment. In recent discussions, we discovered teams building and evolving observability solutions comprising 10 to 20 people in large internet organizations. The resources used by these solutions, both at runtime and in terms of storage, ranged from 3 percent to 18 percent of the total system resources and in one case monitored approximately 500 million separate metrics per minute. When systems execute on thousands of nodes with petabytes of data, a lot of resources must be dedicated to observability, which is a testament to the necessity of this capability. An example description of Twitter's solution in this area can be found here. Likewise a description from Netflix on its efforts to design and build its next generation of innovative insight tools for operational visibility is available here.
Observability Stack
The figure below represents an abstraction of the common components of an observability solution, organized as a layered architecture. We describe key capabilities required and inherent design trade-offs for each layer in the following:
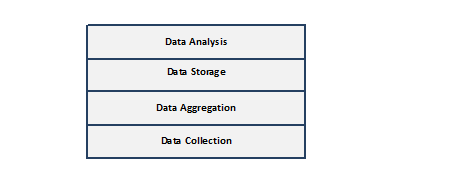
- Data collection: There are two elements to data collection: specifying what to collect and periodically gathering raw data from every node in the system. A component should be dynamically configurable to specify the application-relevant data to capture--this can be done using a framework such as Archaius. Measured data should then be transported to a distributed data collection capability that either periodically pulls data from every node or accepts data that is pushed from multiple nodes. Key design decisions in this layer revolve around the number of measures collected, at what frequency, and whether nodes themselves perform some local pre-preprocessing of data, with a potential loss of fidelity, or whether raw data is transported for further processing. These alternatives represent design trade-offs that can greatly affect the amount of resources used by the observability framework and its ability to scale.
- Data aggregation: Aggregation is essential to constructing application-relevant metrics from raw data points. As a simple example, in a horizontally distributed database, the number of reads and writes served per time interval is the sum of the requests served by every database partition. Another example is for a business transaction level; the overall latency will be determined by the response times of all the lower-level services called. Should the business transaction itself measure these? Or, should the services themselves report their latencies so that they can be aggregated across all requests from different services? In terms of design trade-offs, the amount of aggregation performed will determine the type of queries that can be efficiently asked of the data and the amount of storage it consumes.
- Data storage: Persisting observability data is necessary for downstream analysis purposes. Major design decisions revolve around whether to store raw as well as aggregated data, and how long the data should be kept. Observability data can quickly become a big data problem in itself, and hence the resources it consumes can become costly. This realization leads to design approaches that only keep fully aggregated and/or raw data for a specific time window (e.g., one month, six months), and dynamically create lower fidelity snapshots of the data for specific time periods (e.g., last day, last week) that are updated daily.
- Data analysis: Both developers and operators need tools to query observability data so they can anticipate and diagnose problems. Querying observability data requires user interfaces for constructing queries and visualizing performance measures in a user-driven fashion. Users should also be able to define triggers that fire alarms when certain metrics stray out of expected ranges (e.g., 95th -percentile response times for a core service exceeds 500 milliseconds). Important design decisions revolve around the usability of the user interface in terms of the ease of constructing queries and visualizing results.
Existing Solutions
Distributed system monitoring tools have existed for many years. Commercial tools, such as AppDynamics, are comprehensive products. However, like their commercial counterparts in the database arena, license costs can become an issue as systems scale across hundreds and thousands of servers. Open source equivalents such as Nagios and Ganglia are also widely used, and a useful comparison of technologies in this space can be found here. Adopting these technologies and tailoring them to highly heterogeneous execution environments to observe application-relevant measures, as well as making them operate at the scale required by the next generation of big data applications, will represent a major challenge for any development organization.
At the SEI, we are researching the creation of highly configurable, scalable, and extensible observability solutions. In this context, being configurable requires tools that would allow a development team to rapidly configure the data collection requirements and trade-off analytic fidelity against resource usage, both for data collection and storage. Being scalable requires a lightweight core framework that is engineered from the ground up to ensure extreme scalability. Finally, being extensible demands rapid modifications are possible to interact with new application endpoints (e.g., databases and middleware) that are introduced during system evolution. Our aim is an observability framework that can be adopted in a cost-effective manner and rapidly customized by a wide range of organizations to help attain high levels of assurance and reliability.
If you're interested in this work, we'd like to hear from you. Please leave a comment below.
Additional Resources
To view Ian Gorton's webinar, Software Architecture for Big Data Systems, please visit
https://resources.sei.cmu.edu/library/asset-view.cfm?assetid=298346.
To listen to the podcast, An Approach to Managing the Software Engineering Challenges of Big Data with Ian Gorton and John Klein, please visit
http://www.sei.cmu.edu/podcasts/podcast_episode.cfm?episodeid=294249&wtPodcast=AnApproachtoManagingtheSoftwareEngineeringChallengesofBigD
Written By

More By The Author
More In Software Architecture
PUBLISHED IN
Get updates on our latest work.
Sign up to have the latest post sent to your inbox weekly.
Subscribe Get our RSS feedMore In Software Architecture
Get updates on our latest work.
Each week, our researchers write about the latest in software engineering, cybersecurity and artificial intelligence. Sign up to get the latest post sent to your inbox the day it's published.
Subscribe Get our RSS feed