Static Identification of Program Behavior using Sequences of API Calls

PUBLISHED IN
Reverse Engineering for Malware AnalysisMuch of the malware that we analyze includes some type of remote access capability. Malware analysts broadly refer to this type of malware as a remote access tool (RAT). RAT-like capabilities are possessed by many well-known malware families, such as DarkComet. As described in this series of posts, CERT researchers are exploring ways to automate common malware analysis activities. In a previous post, I discussed the Pharos Binary Analysis Framework and tools to support reverse engineering object-oriented code. In this post, I will explain how to statically characterize program behavior using application programming interface (API) calls and then discuss how we automated this reasoning with a malware analysis tool that we call ApiAnalyzer.
Recall that Pharos is a framework that uses the ROSE compiler infrastructure developed by Lawrence Livermore National Laboratory for disassembly, control flow analysis, instruction semantics, and more. ApiAnalyzer is built using the Pharos framework to reason about system behaviors in malicious code. In particular, Pharos makes information about API function call usage available for deeper evaluation by tools like ApiAnalyzer.
ApiAnalyzer can analyze any Microsoft Windows executable. However, I've found it especially useful for RAT tools that frequently include system-administration capabilities, such as listing system process information, accessing files, and manipulating data stores. The overwhelming majority of the time, these capabilities are implemented through the operating system using API calls. For instance, Figure 1 below shows the common way to list the processes running on a system using the Windows Tool Help Functions. The API calls used are highlighted in red.
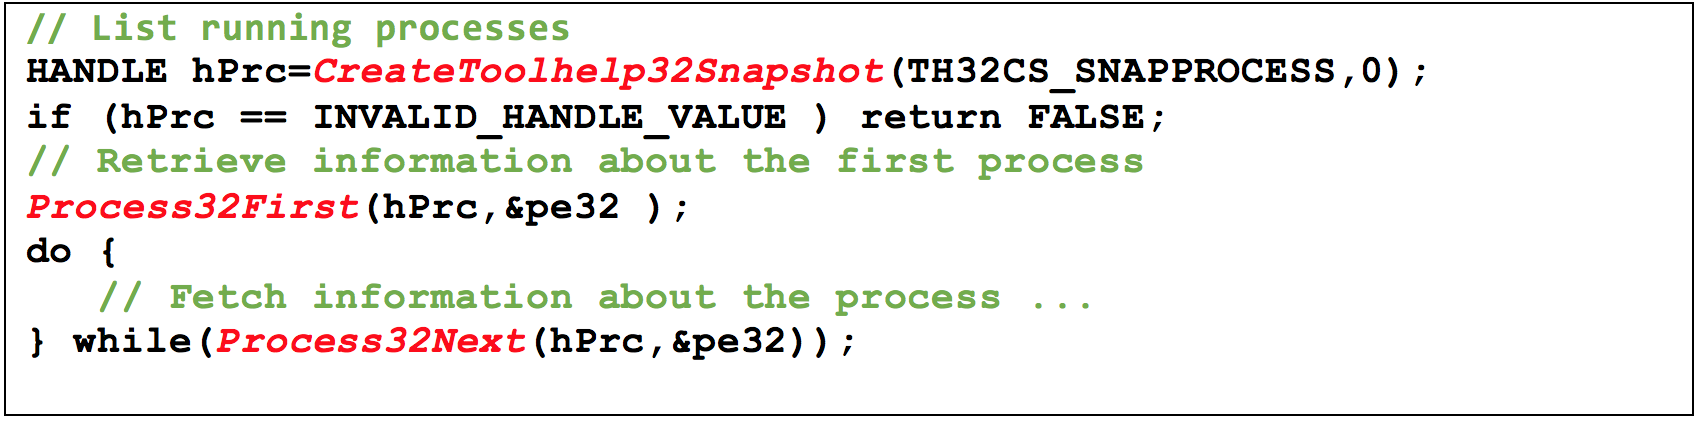
A skilled analyst looking at the code in Figure 1 would recognize the Windows Tool Help Functions and quickly get a sense that these calls use process information. Using API calls to identify program behavior is not new: many commercial tools, such as malware sandboxes, include functionality to capture API call traces during execution. Such dynamic tools, however, are limited because they only report on what actually does occur during execution. Functionality will not be traced if it requires extensive user interaction, relies on exceptional code paths, or requires specific environmental conditions, such as a certain time of day to execute. On the other hand, static analysis of API call information allows for more thorough reasoning because the entire codebase can be explored, rather than what was actually executed and observed.
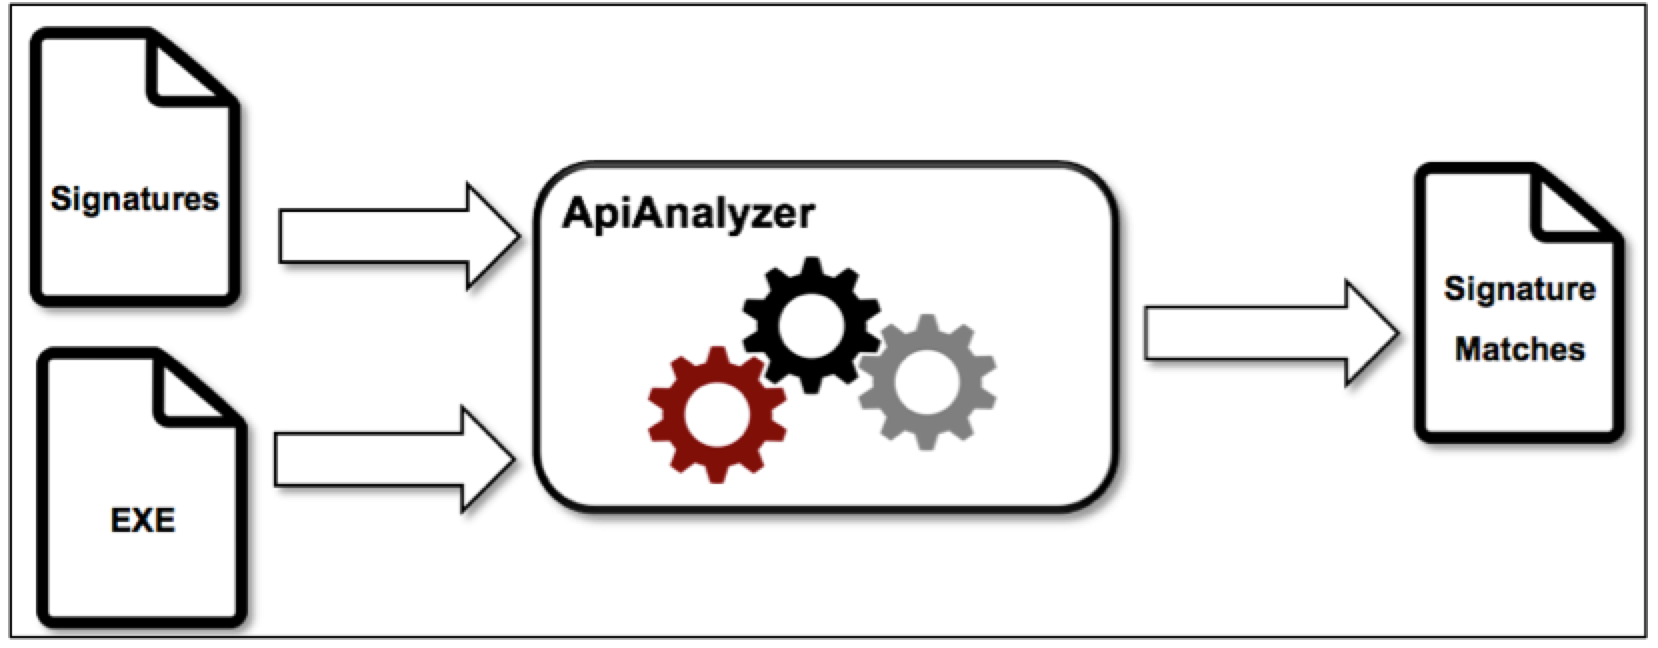
CERT analysts have been using ApiAnalyzer to automatically detect sequences of API calls in Microsoft Windows executables. This type of analysis enables detection of interesting behaviors expressed through API calls. ApiAnalyzer is signature driven, meaning analysts must supply the list of API calls to search for in an executable. Figure 2 shows the typical ApiAnalyzer workflow. A malware analyst supplies signatures (i.e., a list of API calls) and executable files while ApiAnalyzer searches the latter for the former, yielding a set of signature matches.
Under the hood, ApiAnalyzer uses Pharos Framework's capabilities to reason about program logic. Specifically, ApiAnalyzer constructs and uses Control Flow Graphs (CFG) for compiled code to follow program logic. These CFGs are generated at the basic block level. The nodes in each CFG contain various information about the program code, including whether the underlying code contains an API call. Figures 3 and 4 show the value of this representation. Figure 3 shows a portion of assembly code containing four Windows API calls (two calls to CreatePipe(), a call to GetStartupInfoA() and a call to CreateProcessA()). The program logic is such that both CreatePipe() calls must succeed to reach the CreateProcessA() call.
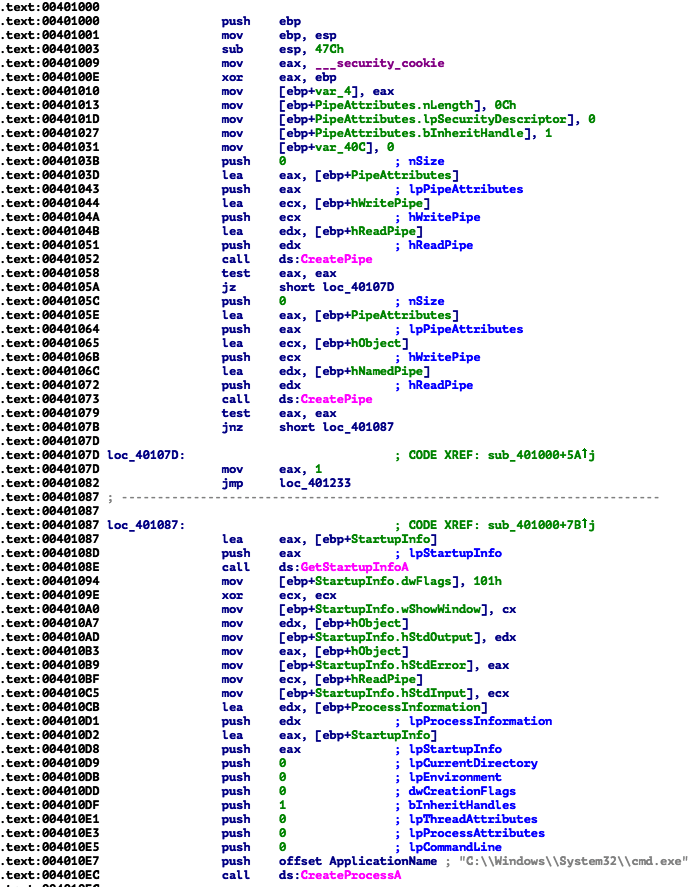
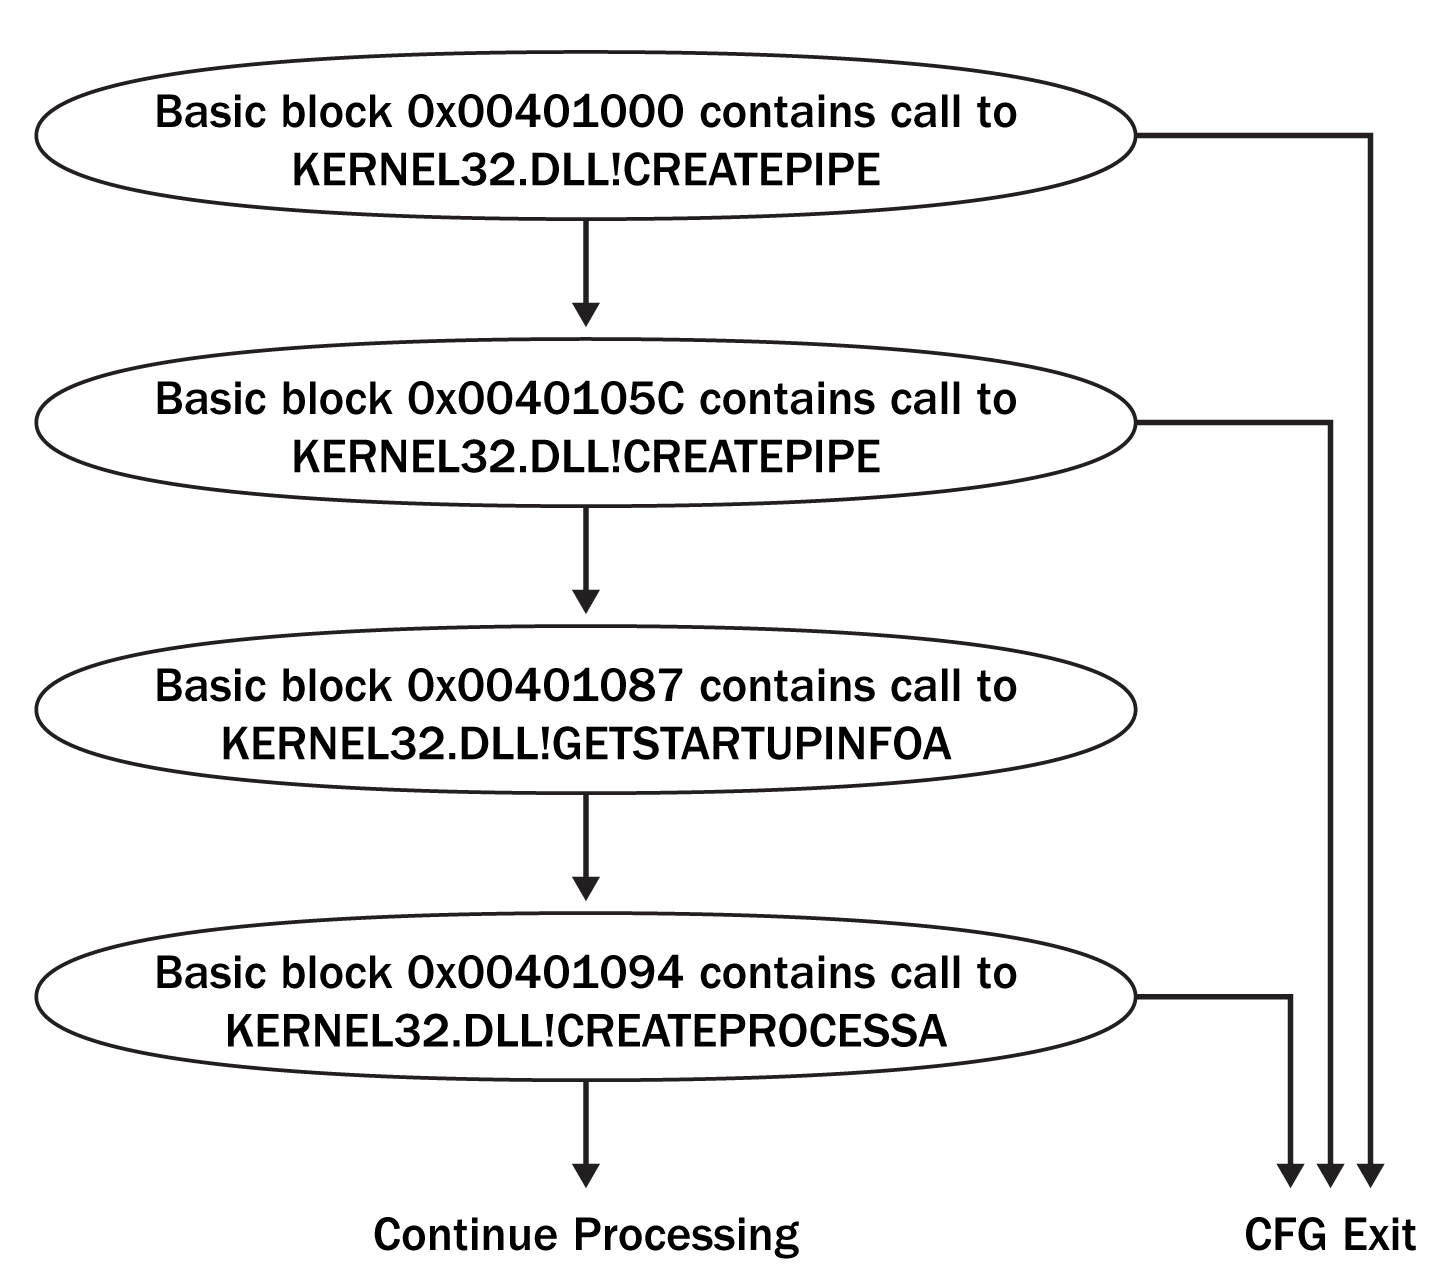
Figure 4 shows this same code represented as a control flow graph with non-API related information removed. This representation unambiguously shows how API calls occur within the program logic. For example, in Figure 4 it is obvious that two distinct calls to CreatePipe() must precede the call to CreateProcessA(). In ApiAnalyzer, a CFG is generated for each discovered program function and then simplified to remove non-API information. Generating CFGs on a per-function basis greatly simplifies searches because per-function graphs tend to be small and simple.
Statically Searching for API Sequences
Searching for meaningful sequences of API calls in a CFG requires simulating program execution. We selected a depth-first search (DFS) approach for traversal because it works in a way that closely resembles the way in which a program executes. From the entry point of a CFG, the DFS algorithm traverses down as far as possible from a given part of the graph before backtracking, ensuring that all vertices are processed during a search.
To demonstrate this algorithm, consider the CFG in Figure 4. The traversal begins at the basic block with address 0x00401000. Next, it will proceed to basic blocks with addresses 0x0040105C, 0x401087, and 0x00401094 respectively before exploring other paths. The DFS-based algorithm mimics control flow in a function, but cannot directly handle interprocedural control flow (i.e., calls to different functions). The search algorithm deals with standard program function calls by starting multiple searches.
Figure 5 shows how interprocedural searches work in ApiAnalyzer. The CFG on the left represents a function that contains a call to another function, which is the CFG on the right. Consider searching for a sequence of API calls that represent a FileWriteTransaction, which consists of API call OpenFile() followed by a call to WriteFile() followed by call to CloseHandle(). Assuming that analysis begins at the entry of the left-hand-side function, which is program address 0x67891234 (i.e., the vertex numbered 1), the search proceeds through the vertex numbered 2 with a call to OpenFile(). Upon passing through this vertex, the first element of the FileWriteTransaction has been found and the new target is the API call WriteFile(). The search proceeds to the vertex numbered 3 to address 0x12345678. This vertex represents a basic block that ends with a call instruction to address 0x12345678. The dashed edge between vertices 3 and 4 represents a transfer of control flow via a call instruction; they are not true edges in the CFG.
To maintain the control flow of the underlying program, the current search is suspended and a new search begins at vertex number 4 which is the entry vertex to a function at address 0x12345678. The new search proceeds in the same depth-first manner. When vertex number 5 is reached (labeled as a call to WriteFile()), the search increments to the final target element: CloseHandle(). The next vertex that is encountered is number 6, which is the exit (return) for this function. At this point the traversal of this graph completes, and the original suspended search in the calling function resumes the original at vertex number 3. Again, the transfer of control flow across function boundaries is represented via a dashed line. Because vertex number 3 has already been explored, it is bypassed, and the search proceeds to vertex number 7, which calls CloseHandle(). This vertex is the final element of the FileWriteTransaction; thus, the search ends with the FileWriteTransaction signature successfully found.

Tracking Data Shared between API Functions
Many common operations use shared data items. For example, the Windows Tool Help Functions shown in Figure 1 use the same HANDLE to maintain state between API calls. Leveraging shared data among API calls can strengthen the meaning of API signatures. From a structural standpoint, knowing API call order at any given point in a program is often sufficient to reason about API-based behaviors. However, relying on control flow alone may result in false positives. The resulting false positives are because control flow provides no information about code paths that are valid from a data flow perspective.
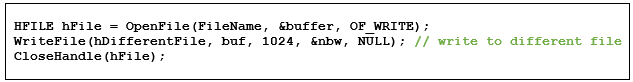
Consider using ApiAnalyzer to search for the FileWriteTransaction signature in Figure 6. From a structural standpoint, the sequence of API calls satisfies this signature(OpenFile() followed by WriteFile() followed by CloseHandle()). However, closer inspection reveals that the call to WriteFile() operates on a different file (referenced by the handle hDifferentFile). To eliminate spurious matches such as these we support tracking data items used by API calls, either as return values or API call parameters. When these are shared between API calls, an analyst can determine if a feasible control flow path exists. ApiAnalyzer includes the capability to track data items shared between API calls and can track these items across function boundaries.
Specifying API Signatures
There are two critical parts of an API signature: the sequence of API calls and the data shared between them. Written in Java Script Object Notation (JSON), the current schema for ApiAnalyzer signatures is shown in Figure 7. Each signature has a Pattern, a Name, a Description, and a Category field to help organize results. The most important part of the signature is the Pattern, where sequences of API calls are specified in the order they will be searched for. Each API call entry must include a label field called API. Data required by the API Pattern:Args field is specified as either parameters (Args) or return values (Retn). Each parameter has a signature-unique label (Name), an Index field that indicates its position in the parameter list, and an IN or OUT attribute. This attribute allows ApiAnalyzer to deal with values that are overwritten in API calls (i.e., pointers). Finally, many API calls have a return values. The return value represents the information passed directly by the API call (as opposed to OUT parameters), typically in registers like EAX/RAX.
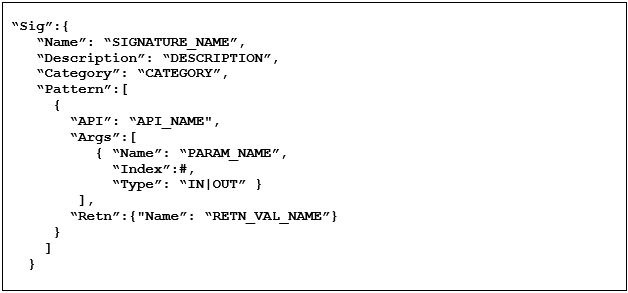
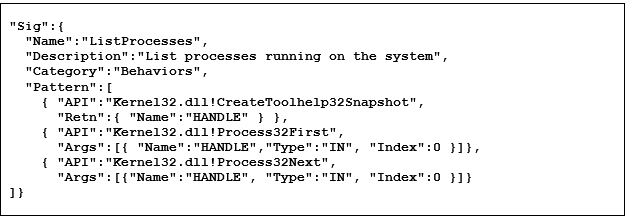
Figure 8 shows the ApiAnalyzer signature to detect listing processes (see Figure 1 for the original code). Note that API call names in the signature include the containing DLL (separated by a "!") to avoid ambiguity. Also note that in this signature "HANDLE" is a signature-unique label that captures the fact that all three of the API calls discovered must operate on the same process handle. Notably, the HANDLE is first set as the return value from the API call CreateToolhelp32Snapshot(). The HANDLE is then passed by value as a parameter to subsequent API calls (Process32First() and Process32Next()) as parameters.
Wrapping Up and Looking Ahead
The capabilities provided by ApiAnalyzer enable reverse engineers and malware analysts to specify and then search for many potentially malicious patterns of interest. This post described how ApiAnalyzer leverages the static analysis capabilities of the Pharos Framework to discover and match sequences of API calls. ApiAnalyzer is just one example of the power of using Pharos to build malware analysis tools. Future posts will highlight other work that CERT is doing in automated binary analysis and describe future improvements that will make work easier for reverse engineers. Please check out the Pharos Static Analysis Tools site and the Pharos GitHub repository for the latest updates to our work.
Additional Resources
For more information on API call analysis and other tools that we are working on check out the Pharos Static Analysis Tools site.
We have also created a GitHub repository for Pharos, and plan to release selected components of our framework for inclusion back into the ROSE infrastructure.
Written By

More By The Author
More In Reverse Engineering for Malware Analysis
PUBLISHED IN
Reverse Engineering for Malware AnalysisGet updates on our latest work.
Sign up to have the latest post sent to your inbox weekly.
Subscribe Get our RSS feedMore In Reverse Engineering for Malware Analysis
Get updates on our latest work.
Each week, our researchers write about the latest in software engineering, cybersecurity and artificial intelligence. Sign up to get the latest post sent to your inbox the day it's published.
Subscribe Get our RSS feed