Programmer Moneyball: Challenging the Myth of Individual Programmer Productivity
PUBLISHED IN
Enterprise Risk and Resilience ManagementA pervasive belief in the field of software engineering is that some programmers are much, much better than others (the times-10, or x10, programmer), and that the skills, abilities, and talents of these programmers exert an outsized influence on that organization's success or failure. This topic is the subject of my recent column in IEEE Software, The End to the Myth of Individual Programmer Productivity.
In the field of baseball research (sabermetrics), researchers who challenged widely held—but erroneous—notions were able to exploit market inefficiencies to their advantage, a development vividly described in Moneyball by Michael Lewis. Similarly, astute software managers can benefit by challenging commonly accepted wisdom. In this blog post, I examine the veracity and relevance of the widely held notion of the x10 programmer. Using data from a study we conducted at the SEI, I found evidence that challenges the idea that some programmers are inherently far more skilled or productive than others.
Our study concluded that the truth is more nuanced. First, I found that most of the differences resulted from a few very low performances, rather than exceptional high performance. Second, there are very few programmers at the extremes. Third, the same programmers were seldom best or worst. While average performance differs between programmers, only half the variation in program-development effort can be attributed to inherent programmer skill; the other half is within the individual developer's day-to-day variation. That is, the programmers differ from themselves as much as they differ from other members of the group. The many studies that seem to show a x10 performance range conflate differences between programmers with normal programmer day-to-day variation.
This finding is important, since it means that
- In the short run, normal performance variation swamps performance. This finding has major implications for the sample size needed for planning, tracking, and evaluating process improvements. More importantly, we notice instances and extremes, not the long-term trends. However, those short-term results are not very predictive.
- The measured range is dominated by the worst, not the best performance. In the extreme case, a programmer does not complete a task. Comparing best to the worst is not very useful.
- Finding a consistently superior programmer is hard, finding a capable programmer is not. Accurately measuring performance requires a substantial body of work.
- Since software project managers have limited ability to evaluate individual developer capability, they should rely on a productive environment and developing talent. Rather than placing all of their focus on recruitment and hiring of the best available programmers, managers wishing to achieve high productivity and quality might be more effective by finding capable programmers and then employing other tools at their disposal. I will discuss some of these tools later in this post.
Belief in the salience and criticality of individual programmer skill within software engineering has a long history, beginning with studies in 1968 by Sackman et al. and later summarized by McConnell (chapter 30), Glass, and others. Estimates of top performers vs. average performers in these studies ranged from 10:1 to 28:1. For teams, Boehm et al. used a factor of almost 4:1, and DeMarco and Lister claimed that organizations varied in their performance almost as much as individuals do.
These influential published assertions have contributed to widely held assumptions about the importance of individual programmer skill. Yet while Curtis's small study of defect fix times (pp. 279-294) suggested a high variation for the same developer on multiple tasks, to the best of our knowledge, none of these original studies separated the variations between developers from the productivity variations of individual programmers from program to program.
The Study
To better understand the causes of software development productivity, we performed our own study. We used data collected from our own work teaching the Personal Software Process (PSP). PSP teaches software developers how to measure their own performance and implement a personal Demming-styled plan-do-check-act improvement cycle. A foundational teaching of the PSP is that improvement starts with consistency. During the PSP class, we compiled and showed class data to the students every day; thus the instructors observed firsthand how individual performances varied from one program to another.
For the study, we used data from the PSP class programming assignments for which students record effort, size, and defects for a series of programs. The students used their preferred programming languages and environments. To simulate a development cycle for their data collection, we had the students read and understand the assigned problem, implement a solution, and then test the solution against a set of predetermined test cases.
The program assignments implemented the data analysis the students performed, including line counting and implementation of statistical calculations. Although the work was mostly mathematical, no special knowledge was assumed, and the instructions provided sufficient detail and examples for a non-specialist to implement the solutions.
In addition to meeting the requirements statement, each solution involved simple input, output, modularization, and the use of control and loop logic. Each was the size of one or two small Agile user stories requiring two or more hours to implement. The student recorded time on the major activities needed to complete a solution that passed all required tests, including planning, design, coding, testing, and personal reviews.
This study used the 10-exercise version of the course, for which each student programmed solutions to the same 10-assignment specifications and collected the direct effort time. Of the 3,800 students in our classes (from 2000 to 2006), this study included only the 494 who used the C programming language and who also completed all 10 programming exercises. Most students were professionals from industry with experience ranging from less than a year (half of the subjects) to 36 years, with an average of 3.7 years.
In this study, productivity was measured as the relative effort compared to the group average for the same program or programs. Relative productivity was expressed both on a ratio scale and in nonparametric-ordered performance rank. Without an objective size (e.g., function points) to compare programs directly, this relative measure is not an absolute measure of productivity across programs; but since our research questions were between and within students, not program assignments, this seemed the most direct measure.


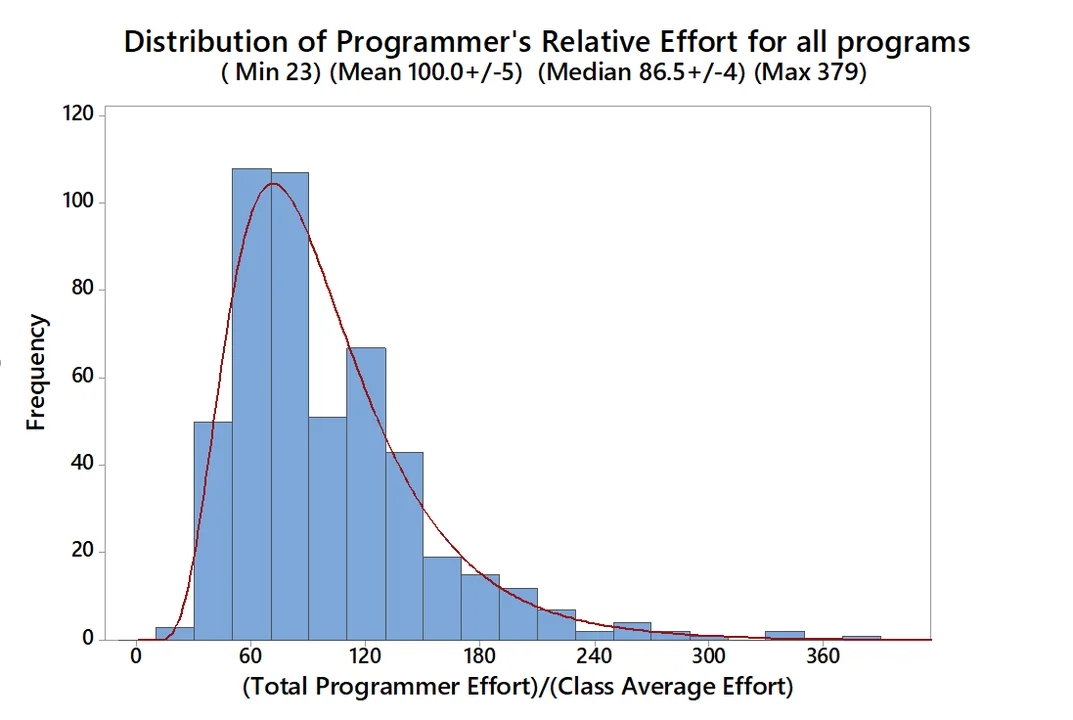
Figure 1 shows how the total course effort of each programmer compared to his or her peers. The range of 23 to 393 suggests a large gap in performance. But there are very few extremes. Half are clustered to within a factor of 2. When looking at individual programming assignments, however, the lowest performing extreme is exaggerated.
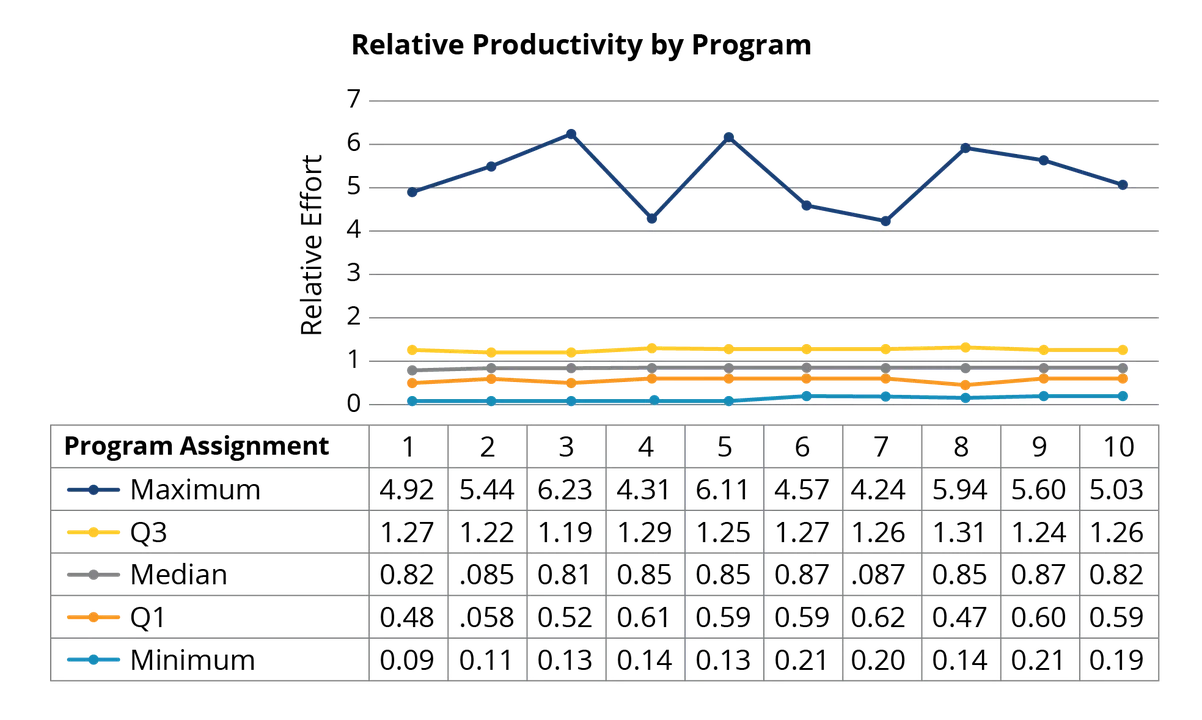
Figure 2 separates the productivity by quartile boundaries for each of the 10 program assignments. We drew two conclusions from this chart:
- Comparing the best to the poorest performer suggests a huge performance range. If we compute the ratio best/worst across our 10 program assignments in Figure 2, we see, maximum/minimum ratios as large as 55:1 and 21:1 These ranges from a single task are consistent with some of the more extreme results reported in the early studies cited above.
- When we consider the entire body of work, not just the outliers, the evidence for super programmers looks weak. When looking at the 25th-75th percentile range, we can see notable uniformity in student productivity (evidence: across program assignments, the Q3−Q1 range is 0.6-1.25).
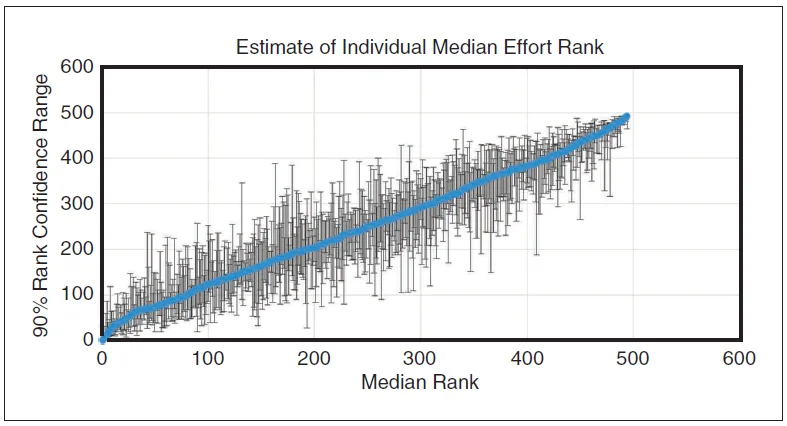
That consistency in the quartile trends hides a more interesting observation about individual programmer consistency. The total body of work has much less spread than the individual efforts. It turns out that programmer's individual performance ranking varies quite a bit, as shown in Figure 3.

Figure 3 explores the variations of each student across programming assignments. To generate these data, within each assignment all students were ranked 1 to 494 based on how quickly they finished that assignment. For each student, those ranks are summarized as
- their median assignment rank (see the blue line in Figure 3)
- the uncertainty interval around that median, using a binomial sampling method (see the gray error bars in Figure 3).
The plot shows the statistical uncertainty of a student's performance ranking, not their range of rankings. The average range for students' assignment rank was much wider, 249. This finding means that an average programmer typically finished everywhere between top to the bottom quartile while a top programmer or bottom programmer was sometimes average. A parametric estimate of variation produced similar results. About half the overall variation in assignment performance was within individual programmer rather than between the programmers.
This chart highlights several important issues.
- The 5% of top or bottom performing students can be confidently be said only to fall within the top or bottom 20%.
- Outside that group, the confidence intervals are so large that one cannot confidently distinguish a student from about half of his or her peers.
- More to the point, this result prompts us to caution managers not to rank their programmers on individual productivity because the measurements are mostly noise. Instead, it is far more useful to explore the sources of variance in programmer performance within each task.
To emphasize the last point, the distribution of relative effort (summarized in Table 1) shows that 90 percent of students fall within a modest performance range. The average coefficient of variation for individual students (42 percent) is not much smaller than the overall variation. In fact, of the 494 students, 482 had at least one program assignment finished in less than the average time, and 415 had at least one program assignment finished in more than the average time. In summary, these statistics show that program-assignment completion time is driven as much by seemingly random and unknown factors as by true programmer-productivity differences.

Implications for Management
These wide performance ranges suggest that even experienced programmers vary widely in performance from one task to the next. Our study suggests that hiring "the best programmers" will not be as effective or simple as we might think.
The idea that top performers can easily be identified and can then be expected to improve productivity may represent a hasty conclusion based on small and insufficient data samples. It takes a substantial body of work to evaluate a programmer's true performance. We had 10 samples each in our study, with identical requirements, under controlled conditions, with no distractions, and it was barely enough data to draw meaningful conclusions. The real world, of course, is far more complex than the limited, controlled study that we conducted.
The efficacy of improving productivity by hiring the best programmers erodes under scrutiny because
- The best are not that much more productive than merely good (on routine tasks).
- There just aren't that many "best performers" available.
- Those that you have will probably be doing more challenging work.
More importantly, managers do still have a number of other tools available to improve productivity. These can be grouped into workflow planning, environment, technology, and training. I will elaborate on some of these in future blog posts. For example,
- Keep tasks small.
- Plan for uncertainty by leaving adequate margins.
- Start critical work early since almost half the time it will take longer than expected, sometimes much longer.
- Don't be fooled by short-term progress.
- Provide a quiet work place so that programmers can focus.
- Emphasize the importance of design to control the complexity and size of solutions.
- Encourage frequent peer review.
- Automate routine tasks such as regression test and deployment.
- Develop talent with training, such as for design, review, and test.
- Since quality can be taught and benefits apply to the total lifecycle cost, emphasize quality rather than speed.
In summary, while some programmers are better or faster than others, the scale and usefulness of this difference has been greatly exaggerated. Experience alone clearly is important, but its value is limited. Rather than try to label programmers with simplistic terms such as "best" and "worst," the most motivating and humane way to improve average performance is to find ways to improve everyone's performance.
Additional Resources
Programmers and managers interested in learning how to incrementally collect data and use that information to improve performance can review Team Software Process and Personal Software Process materials.
Read other SEI blog posts by Bill Nichols.
For a more detailed treatment of the study described in this post, read the article in IEEE Software from which this blog post was derived, The End to the Myth of Individual Programmer Productivity.
Review the student assignment data on which the study described in this post was based.
More By The Author
More In Enterprise Risk and Resilience Management
Process and Technical Vulnerabilities: 6 Key Takeaways from a Chemical Plant Disaster
• By Daniel J. Kambic
PUBLISHED IN
Enterprise Risk and Resilience ManagementGet updates on our latest work.
Sign up to have the latest post sent to your inbox weekly.
Subscribe Get our RSS feedMore In Enterprise Risk and Resilience Management
Process and Technical Vulnerabilities: 6 Key Takeaways from a Chemical Plant Disaster
• By Daniel J. Kambic
Get updates on our latest work.
Each week, our researchers write about the latest in software engineering, cybersecurity and artificial intelligence. Sign up to get the latest post sent to your inbox the day it's published.
Subscribe Get our RSS feed
