A New Approach to Prioritizing Malware Analysis

Every day, analysts at major anti-virus companies and research organizations are inundated with new malware samples. From Flame to lesser-known strains, figures indicate that the number of malware samples released each day continues to rise. In 2011, malware authors unleashed approximately 70,000 new strains per day, according to figures reported by Eugene Kaspersky. The following year, McAfee reported that 100,000 new strains of malware were unleashed each day. An article published in the October 2013 issue of IEEE Spectrum, updated that figure to approximately 150,000 new malware strains. Not enough manpower exists to manually address the sheer volume of new malware samples that arrive daily in analysts' queues. In our work here at CERT, we felt that analysts needed an approach that would allow them to identify and focus first on the most destructive binary files. This blog post is a follow up of my earlier post entitled Prioritizing Malware Analysis. In this post, we describe the results of the research I conducted with fellow researchers at the Carnegie Mellon University (CMU) Software Engineering Institute (SEI) and CMU's Robotics Institutehighlighting our analysis that demonstrated the validity (with 98 percent accuracy) of our approach, which helps analysts distinguish between the malicious and benign nature of a binary file.
The purpose of this project was to facilitate malware analysis by placing incoming malware samples in a prioritized queue. Those samples at the top of the queue would be considered the most dangerous and given highest priority for full analysis. This prioritization provides an order to a large set of malware samples, thereby guiding analysts in deciding which malware samples to analyze first.
Background
When the highly dangerous Flame virus was discovered in 2012, it came to light that a sample of this malware was in the repository of a major anti-malware company for at least two years. This incident motivated this research by observing that a malware analyst may have no way of choosing which malware to analyze first from a large repository. The repository may have a mix of both malicious and benign files.
Several analysis systems currently exist including
- Anubis
https://seclab.cs.ucsb.edu/academic/projects/projects/anubis/ - BitBlaze
http://bitblaze.cs.berkeley.edu/ - Cuckoo Sandbox
www.cuckoosandbox.org - Joe Security
https://www.joesecurity.org/ - Malheur
http://www.mlsec.org/malheur/ - Norman Shark
https://www.symantec.com/products/atp-content-malware-analysis - Darkpoint
https://darkpoint.us/
These systems do a good job at informing a user what a binary under analysis does when executed, but do not perform any prioritization of samples for analysis. Analysts therefore need an automated approach to analyzing these files, getting a sense if they are benign, seen before malware, not seen before malware, and malware that is highly dangerous, and having the samples prioritized based on a set of features representing highly malicious malware that require high priority for analysis. With such an automated method in place, the analyst's job of choosing which sample to start with is greatly simplified, producing a streamlined process of deep malware analysis that focuses on the most dangerous samples first.
Approach
To create a prioritized queue of malware samples in an efficient manner for a large set of incoming files, we decided to run each sample through a runtime analysis system for three minutes. The use of runtime analysis helped us quickly understand how a sample interacts with the underlying operating system. These interactions create execution events from which features can be extracted and used in our prioritization.
We used the CERT Malicious Code Automated Run-Time Analysis (MCARTA) Windows runtime analysis system for this research. The system was given five sets of sample inputs:
- A set of 2,277 known benign samples, all consisting of WIN32 Portable Executable files
- A set of 65 known malicious samples, the samples were the top ranked most infectious and wide spreading during the 2008-2013 period, as ranked by Kaspersky's yearly reports
- A set of 291 malware samples named in the Mandiant APT1 report
- A set of 1884 malware samples from the Citadel and Zeus families
- A set of 11K known malicious samples downloaded from virusshare.com
The sets described in items 1- 4 above were used for training classification and clustering algorithms, the set in 5 was used for testing. As each malware was fed to MCARTA, the runtime analysis lasted three minutes and the results were stored in reports. We built customized scripts to extract the desired features from the reports and place them in a comma-separated value file. These files were saved for later use in the research. We added the malware names for each sample from the anti-malware engines F-Secure, Microsoft, and Symantec that were being used by the anti-malware scanner service VirusTotal. The queries to VirusTotal were automated via a script that used VirusTotal's web-based application programming interface (API) set.
The features used in this research were based on our prior experience with runtime analysis and detection of malware. Our methodology was based on our suspicion assessment approach by asking the question "Who are you?" + "What do you do?" The first question provides provenance, which, for this research, we have defined as the person or group that developed the source code of the file under analysis, and attribution of the static file image for a given process and was answered by checking for a verified digital signature. The second question is based on the execution events of a process on a system and was answered using the extracted features from our MCARTA runtime analysis framework.
The features can be grouped in two broad areas: observed and inferred. Observed features are identified directly from the captured data, whereas inferred features required analyzing the captured data to conclude if a specific event occurred or not. Our focus for feature selection was on behaviors related to infection, injury, and survivability used by malware when entering a system:
- Infection is normally an essential component of malware facilitating the spreading of the malware in other files and processes. This assists the malware in achieving several goals such as delegation of nefarious deeds to other processes and detection avoidance.
- Injury is used by malware to damage the target system in some way including data stealing, access denial to essential system components, and deletion of files and processes.
- Survivability is the malware's need of running undetected for as long as needed to complete its overall goal. To survive, a malware can carry out several acts, such as stopping or deleting anti-malware software and running secretly as a background process or service.
One can surmise that for any given malware at least one of these three behaviors are in use and can be identified via the various techniques used to implement them during runtime. Our features represent the techniques that can be used to implement these three behaviors of malware within the universe of file system, process, and network activity of an end host computer. The features used in this research were based on the Windows 7 operating system and were as follows:
File System
- Observed:
Open Files
Find Files
Create Files
Get file attributes
Move Files
Copy Files
- Observed:
- Inferred:
Attempts to delete self
Copy/Move self to other file system location
Open standard windows cryptography related dll
Registry
- Observed:
Created registry keys
Open Keys
Set Value
Delete Value
Enumerate Value
- Observed:
- Inferred:
Values deleted from machine/currentversion/run/ registry key
Disable antimalware from starting on reboot by deleting its value from currentversion\run registry key
Set value currentversion/run to start self or copy of self at reboot
Set value in a registry key created by sample
Delete values with Registry key \CurrentVersion\Internet Settings
Deleted registry keys referring to an anti-malware product
Processes
- Observed:
Created Processes
Kill Processes
Open Processes
- Observed:
- Inferred:
Process started from file created by sample
Dynamic code injection: open process with desired access, create thread & write
Windows Service
- Observed:
Open Services
Create Service
System Environment
- Observed:
Sleeps
Enumerate System Modules
Check for Kernel Debugger
Threads
- Observed:
Create Threads
Network Activity
- Observed:
Create Objects
DNS Requests
- Observed:
- Inferred:
Connection attempts excluding localhost (127.0.0.1)
Maximum connection attempts to same IP address
Different non-localhost IP addresses used in connection attempt
Digital Signature
- Observed:
Verified Digital Signature
Window GUI
- Observed:
Create Window of size 0
Our previous research indicated the inferred features above are highly suggestive of malicious behaviors by malware; their occurrence indicates high suspicion of potential malware presence. These features were collected for the process under analysis. During the analysis, we created a malware infection tree and extracted features for each process in the tree.
Evaluation Criteria
Our research is evaluated based on the usability of the chosen features to differentiate between malicious and benign samples with minimal false positives and false negatives. Further evaluation is based on producing a priority queue with an ordering of samples allowing an analyst to decide which samples to analyze first. The samples that are initially analyzed should be either the most malicious in the set either based on their features or their absence of features potentially indicating an ability to carry out nefarious deeds in a benign like manner.
Results
After collecting all needed features, we analyzed the data with different classification and clustering techniques to determine the correctness and usefulness of the feature set for prioritizing malware samples. We labeled each sample with its name from F-secure, Microsoft, and Symantec by submitting the SHA256 hash value to virustotal.com via their API set. From the 11K samples only 8,969 samples were used to report the research results. The remaining samples had non-identifiable answers or error messages returned from VirusTotal.com and were therefore omitted. The tests performed were as follows:
- Test 1: Attempt to separate benign from malicious in the training sets.
- Test 2: Prioritize malware samples for analysis based on their execution behavior.
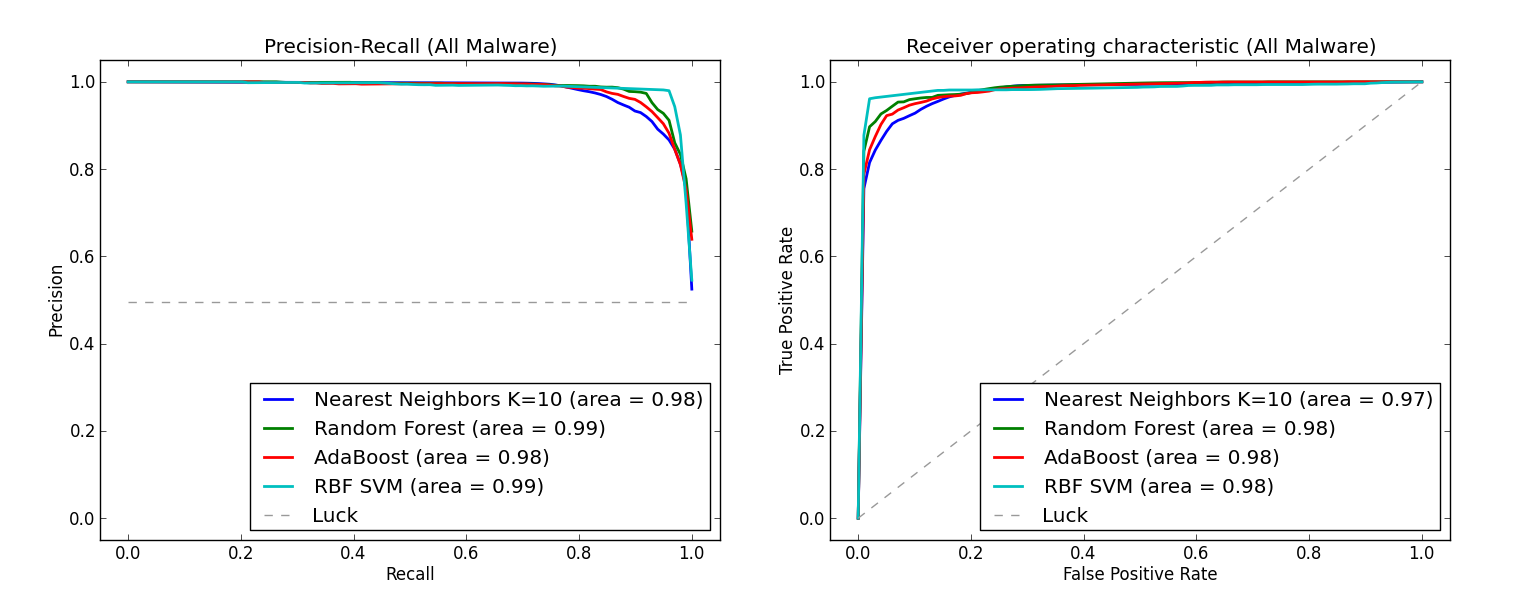
Test 1 was meant to validate if our runtime features were capable of differentiating between known benign and known malicious samples. We selected a group of popular classification algorithms--i.e., K-Nearest Neighbor (K = 10), Random Forest, AdaBoost, and Support Vector Machine (RBF Kernel)--and evaluated them using 10-fold cross validation. K-fold cross validation splits the data into K equally sized chunks; the algorithms are trained on K-1 chunks and evaluated on the remaining chunk. This process is carried out with each of the K chunks serving as the evaluation set, and results are averaged across all K evaluations.
We used two popular metrics for our evaluation of classification accuracy: area under the precision/recall (PR) curve, which measures how well each method can distinguish between malicious and benign samples, and area under the receiver operating characteristic (ROC) curve, which measures the false positive rate required to experience a particular true positive rate. For the PR curves, each algorithm assigns a score to each sample in the data set, where a higher score indicates that the sample is believed to be more malicious, and we measure how well the method ranks true malware above benign samples.
The list of sample scores returned by an algorithm are sorted and iterated through: at each step, we use the score of the current sample as a threshold for classifying anomalies, and calculate the algorithms precision (number of correctly identified malware divided by the total number of predicted malware) and recall (number of correctly identified malware divided by the total number of true malware). For the ROC curves, the same process above is followed, however at each step, we use the score of the current sample as a threshold for classifying anomalies, and calculate the algorithms true positive rate (number of correctly identified malware divided by the total number of true malware) and the false positive rate (number of correctly identified benign samples divided by the total number of true benign samples).
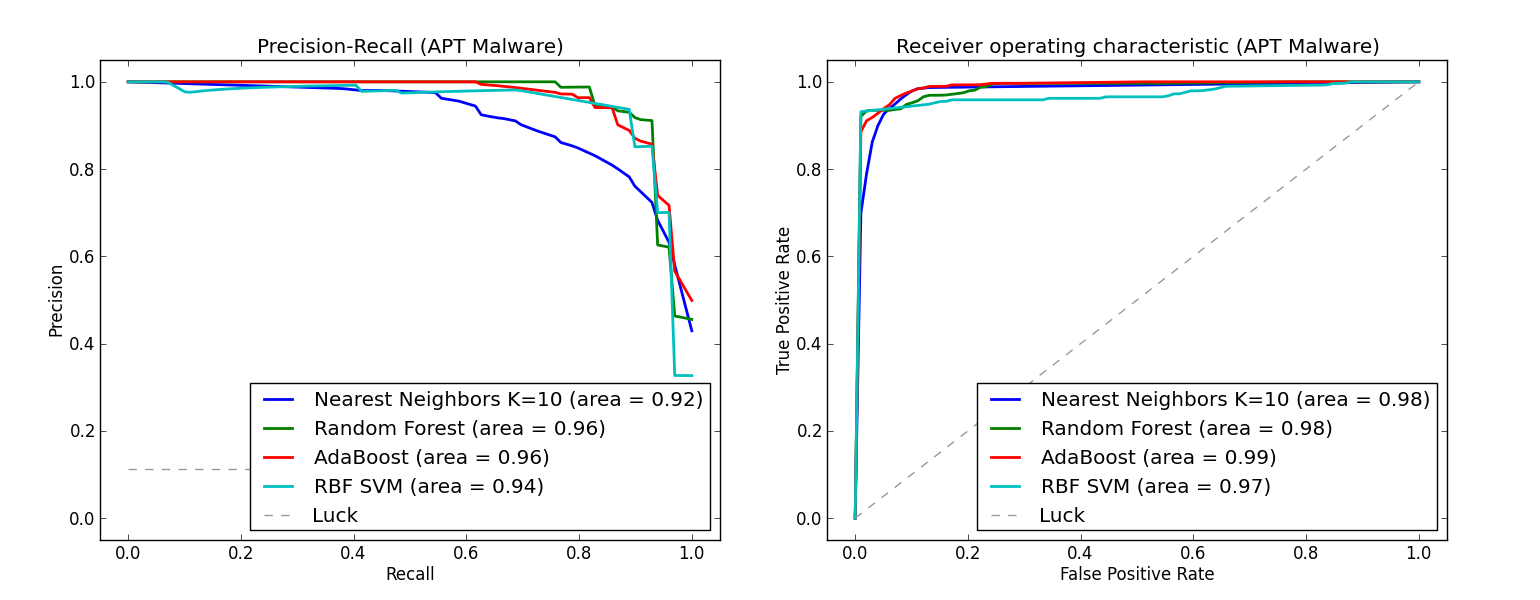
According to the graphs below, we observe that these popular classification algorithms are consistently able to distinguish between benign and malicious samples, i.e., experiencing >=98 percent average area under the PR curve and >= 97 percent average area under the ROC curve. Additionally, for the particularly important case of advanced persistent threat malware, Random Forest and AdaBoost, well regarded ensemble methods, experienced more than 96 percent average area under both curves, further indicating that the runtime features we selected are extremely useful in identifying the malicious or benign nature of a sample.
Test 2 was carried out using the 11K samples as the test set. K-means clustering was used to group together malware with similar execution behaviors. The results are shown in the pie chart below.
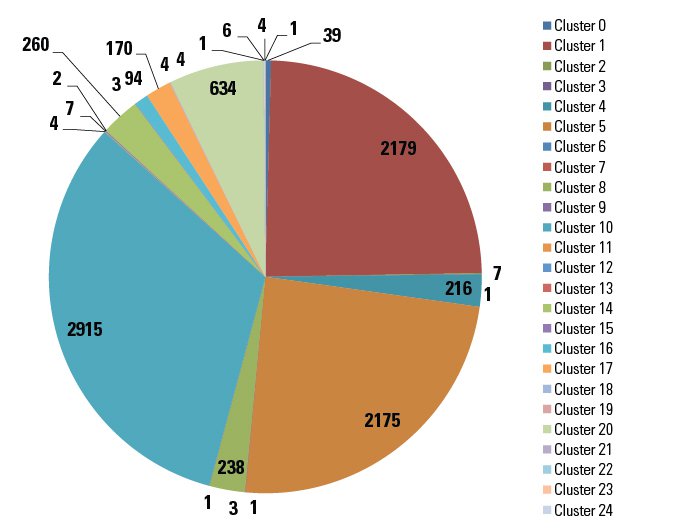
As shown in the pie chart above, a total of 25 clusters were formed with three large clusters, a handful in the hundreds, and the remaining samples in clusters of 10 samples or less. Each of the clusters was a mixed batch of samples from known malware families along with several samples labeled as a variant or generic. Only cluster 2 had a majority of samples from the same family. Consisting of seven total samples, six of these were identified by F-Secure as Trojan.Crypt.HO, the seventh sample was Win32.Sality.3. Since Adaboost and Random Forest gave the best results from Test 1, we report their ranking of clusters and individual samples for prioritizing malware analysis.
The table below shows the confidence percentage of a specific cluster being malicious by Adaboost and Random Forest. The first column is the cluster number, the second is the Adaboost confidence percentage, the third column is the Random Forest confidence percentage, the fourth column is the difference in the two confidence percentages and the fifth column is the average of the two confidence percentages for each cluster. The difference in confidence percentage was minimal in most cases implying a strong agreement by both Adaboost and Random Forest on the certainty of a cluster being malicious or not. Clusters 3, 19, and 21 had 100 percent confidence by Adaboost and none had similar confidence by Random Forest with cluster 19 the closest at 93.7 percent. Clusters 18,19, and 20 ranked highest in Random Forest and had much more similar scores in Adaboost. The average of the two confidence scores is very revealing with clusters 18,19,15,16 ranking the highest. Cluster 18 was the highest average confidence percentage overall, that cluster consisted of 4 samples, 3 were Trojan.generic and one was variant.symmi.
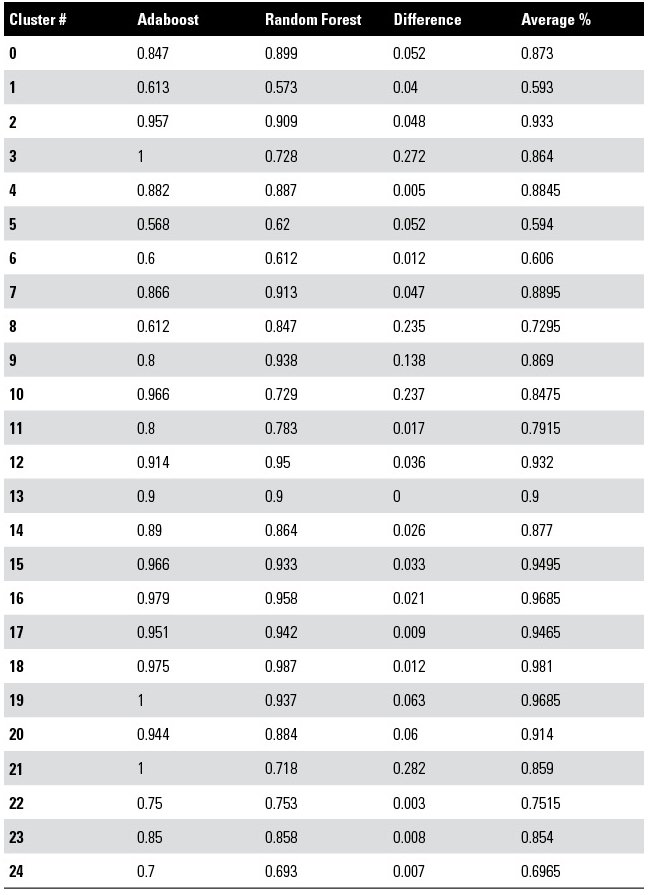
Although Adaboost and Random Forest are both ensemble methods, the methods optimize different loss functions, and therefore can provide different vantage points on the maliciousness of a sample. Averaging confidence scores of several machine learning algorithms can provide a majority consensus of agreement of maliciousness providing a strong basis for deciding which clusters are truly the most malicious in a given data set. In practice, these results are typically based on a single algorithm's results, but our study suggests majority consensus could be a better approach.
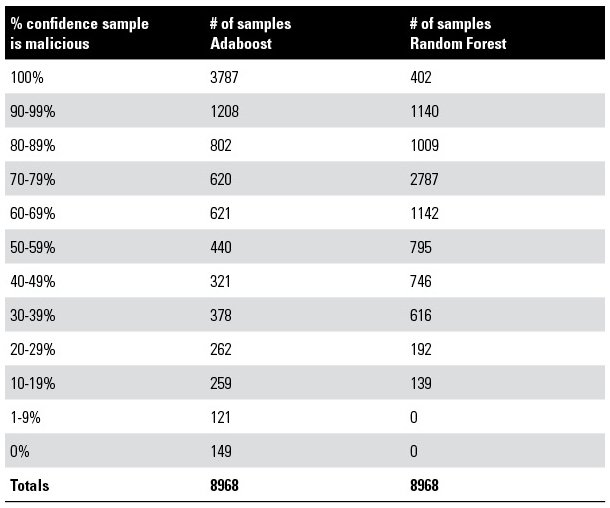
The table below shows the number of individual samples with their confidence percentage for Adaboost and Random Forest. From the results, Random Forest did not have 0 percent confidence of a sample being malicious, implying no false negatives were produced. Adaboost had 0 percent confidence for 149 samples which can be equated as 1.6 percent false negative rate. Random Forest placed most samples in the 60-99 percent confidence range where Adaboost had the majority in 90 to 100 percent range. The results show a tradeoff between no false negatives but lower confidence in random forest or much higher confidence with some false negatives in Adaboost. In practice, low or no false negatives is preferred since one missed malware can be enough to comprise an entire system, its users and data.
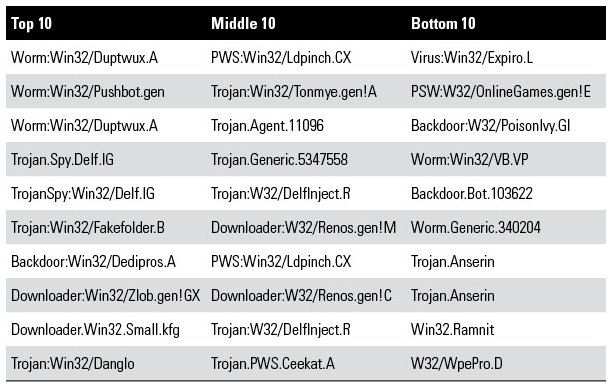
In our research, individual malware samples were prioritized by the confidence score given by Random Forest due to no false negatives being produced. The names of the top, middle, and bottom 10 ranked individual samples from Random Forest are listed in the table below. The top 10 consist of samples from known malware families, the middle 10 contain 1 generic and 1 non-descript sample. The bottom 10 also contain 1 generic and 1 non-descript sample. Though the top 10 are considered most malicious since they were determined by Random Forest to be the most similar to our training data, the bottom 10 included samples of well-known malware families such as Expiro, PoisonIvy, Anserin and Ramnit. The presence of these samples in the bottom 10 could suggest they were either analysis aware, unable to execute correctly in our analysis environment, or able to execute quietly and did not produce the needed features for our analysis to rank them higher.
The 402 samples receiving a 100 percent confidence in Random Forest were considered the most malicious of the test set and thus received highest priority. Recall the algorithms were trained on the observed and inferred features previously discussed and thus these 402 samples are seemingly the most similar to the trained data. Conversely the samples ranked lower at the 10 to 19 percent and in the 0 to 9 percent category of Adaboost may equally deserve high priority since all analyzed samples were known malware samples. Therefore lower ranking confidence and especially 0 percent confidence can be malware samples that are either very stealthy in their execution, are aware they are under analysis and thus purposely act benign, or could have not executed as expected due to missing required resources in our analysis environment. In general, analyzing the highest and lowest ranking samples in a priority queue may be a highly effective approach to prioritizing malware samples for analysis.
Collaborations
I led this research with support from the CERT Cyber Engineering Solutions Group led by technical manager Hasan Yasar and Dr. Jeff Schneider of CMU's Robotics Institute. Edward McFowland III, a Ph.D. candidate at the Heinz College and a master's student in the Machine Learning Department) provided machine-learning expertise.
Concluding Remarks
In this research, we set out to make malware analysis easier by using machine learning to prioritize samples based on their runtime behaviors. The prioritized samples are ordered in a queue with the most malicious at the top. The analyst can simply analyze samples as they appear in the queue. Our feature set of runtime behaviors produced a precision recall of greater than 98 percent and greater than 97 percent for ROC curves in differentiating between known benign and known malicious samples. In the specific case of advanced persistent threats, our analysis produced greater than 96 percent for both curves.
These results verify that our runtime features are highly useful in determining the malicious nature of a sample. Based on these results, we prioritized our samples with highest priority going to the samples at the top and bottom of our results lists. These were considered the most malicious due to their similarity with our training set (top of list) and the potential ability to modify behavior and appear benign (bottom of list). Our results also suggest that averaging confidence scores of several machine-learning algorithms could provide a majority consensus of agreement of maliciousness of a sample. This produces a strong basis for deciding which samples are truly the most malicious in a given data set. In practice, machine-learning-based malware detection is typically based on a single algorithm's result, but our study suggests that a majority consensus could be a better approach.
Our future work will focus on expanding our feature set as malware evolves by detecting their new techniques. We will also create real-time malware detection systems for various operating systems using our feature sets. We will continue to improve current machine-learning algorithms to more accurately differentiate between the malicious and benign nature of a given sample.
We welcome your feedback on our approach and analysis of our results. Please leave feedback in the comments section below.
Additional Resources
To listen to the CERT Podcast, Characterizing and Prioritizing Malicious Code with Jose Morales and Julia Allen, please click here.
To read about other malware research initiatives at the SEI, please visit /blog?tag=malware
Written By

More By The Author
More In Reverse Engineering for Malware Analysis
PUBLISHED IN
Get updates on our latest work.
Sign up to have the latest post sent to your inbox weekly.
Subscribe Get our RSS feedMore In Reverse Engineering for Malware Analysis
Get updates on our latest work.
Each week, our researchers write about the latest in software engineering, cybersecurity and artificial intelligence. Sign up to get the latest post sent to your inbox the day it's published.
Subscribe Get our RSS feed