Pharos Binary Static Analysis Tools Released on GitHub

In a previous post, I discussed the Pharos Binary Analysis Framework and tools to support reverse engineering of binaries with a focus on malicious code analysis. Recall that Pharos is a CERT-created framework that builds upon the ROSE compiler infrastructure developed by Lawrence Livermore National Laboratory for disassembly, control flow analysis, instruction semantics, and more. Pharos uses these features to automate common reverse engineering tasks. I'm pleased to announce that we've updated our framework on GitHub to include many new tools, improvements, and bug fixes. In this post, I'll focus on the tool-specific changes.
OOAnalyzer
OOAnalyzer (based on one of the earliest Pharos analysis tools, ObjDigger) recovers C++-style classes from executables. In this release, we've changed the fundamental way that we analyze object-oriented data structures. The OOAnalyzer methodology for identifying classes and class features is now based on constraint solving with XSB Prolog. We shifted to this methodology because the ObjDigger's non-declarative approach would often reach a conclusion about class relationships based on incomplete information. The crux of the problem was that early speculative decisions in ObjDigger's analysis affected subsequent choices with no way to revisit or revise. What we needed was a way to refine results as more information became available; Prolog meets this need. Rather than making decisions sequentially, OOAnalyzer accumulates context-free facts that are exported to Prolog for higher-level semantic analysis. When a line of reasoning doesn't work out, Prolog backtracks and searches for a different solution. I will discuss this approach in a future post in more depth, including our reasons (such as performance) for selecting XSB Prolog.
PyObjDigger
Another new item in this release is the PyObjDigger plugin for the IDA Pro Disassembler that is included the tools/objdigger/ida directory in the repo. This plugin allows analysts to ingest, view, and modify ObjDigger results directly into IDA Pro. Figure 1 shows a screen shot of the PyObjDigger plugin in IDA Pro. Note that the recovered C++ data structures are presented as IDA structures and listed in a special ObjDigger Classes window that includes members and methods.
Conceptually, OOAnalyzer's output is semantically compatible with the PyObjDigger plugin, but the plugin currently only accepts ObjDigger's JSON syntax. We are planning to add IDA Pro plugin support to OOAnalyzer soon.
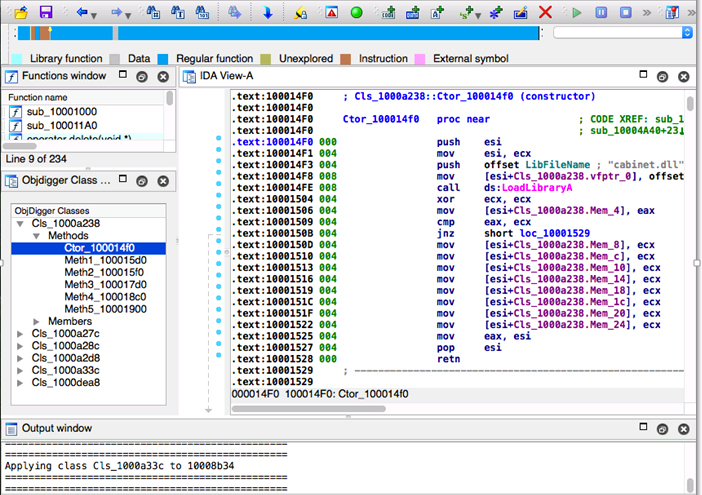
Figure 1: PyObjDigger IDA Pro Disassembler Plugin
CallAnalyzer
A completely new tool included in this release is CallAnalyzer. Malware analysts often use dynamic instrumentation tools to gain insights into what a malware sample does to a compromised system. These tools record common events, such as accessing files, opening network connections, updating registry keys, and launching new processes - any of which can be indicators of malicious activity. Dynamic monitoring tools, however, have a few notable limitations:
- Instrumentation tools typically collect data by executing the malware. There are few indications that the collected data captures all of the malware's capabilities. Thus, you only get what actually executes, not what could execute.
- These tools are typically designed for system monitoring. Although system monitoring tools are useful for malware analysis, they tend to collect events indiscriminately from all running processes, which results in an enormous number of recorded events that are not all relevant to understanding the malware.
- Traditional dynamic monitoring tools are often tuned to low-level system events and may miss interesting program-level patterns of activity indicated by API function calls.
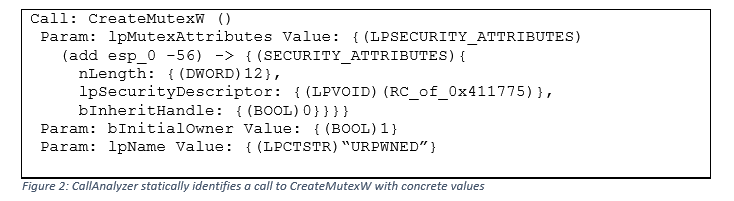
CallAnalyzer addresses many of these limitations by statically reasoning about information passed to all function calls in an executable. The tool includes a type analysis system that provides specific information about complex input parameters, such as data structures passed as arguments. CallAnalyzer statically recovers the arguments and values supplied to this call by reasoning about the state of memory when the call is made. This recovery process can lead to valuable insights, such as discovering mutex names, which are often used as distinguishing features for malware families.
Consider CallAnalyzer's analysis of an executable calling the Win32 API CreateMutex function. In Figure 2 below, CallAnalyzer identifies the type, program-stack location, and value of the mutex lpName parameter ("URPWNED" in this example). CallAnalyzer can also understand complex types and data structures and pointers. For example, the first parameter to CreateMutex is actually an LPSECURITY_ATTRIBUTES type, which is an alias for a pointer to a SECURITY_ATTRIBUTES data structure. CallAnalyzer recognizes that LPSECURITY_ATTRIBUTES is a pointer type and interprets the contents pointed to as a SECURITY_ATTRIBUTES structure, including concrete values.
Fn2yara and Fn2Hash
Fn2Hash and Fn2yara are utilities for generating function hashes and YARA signatures. I will discuss them together because they operate in similar ways. Fn2yara statically analyzes an excutable file and emits candidate YARA signatures for each identified function. Table 1 shows an example invocation of Fn2yara.
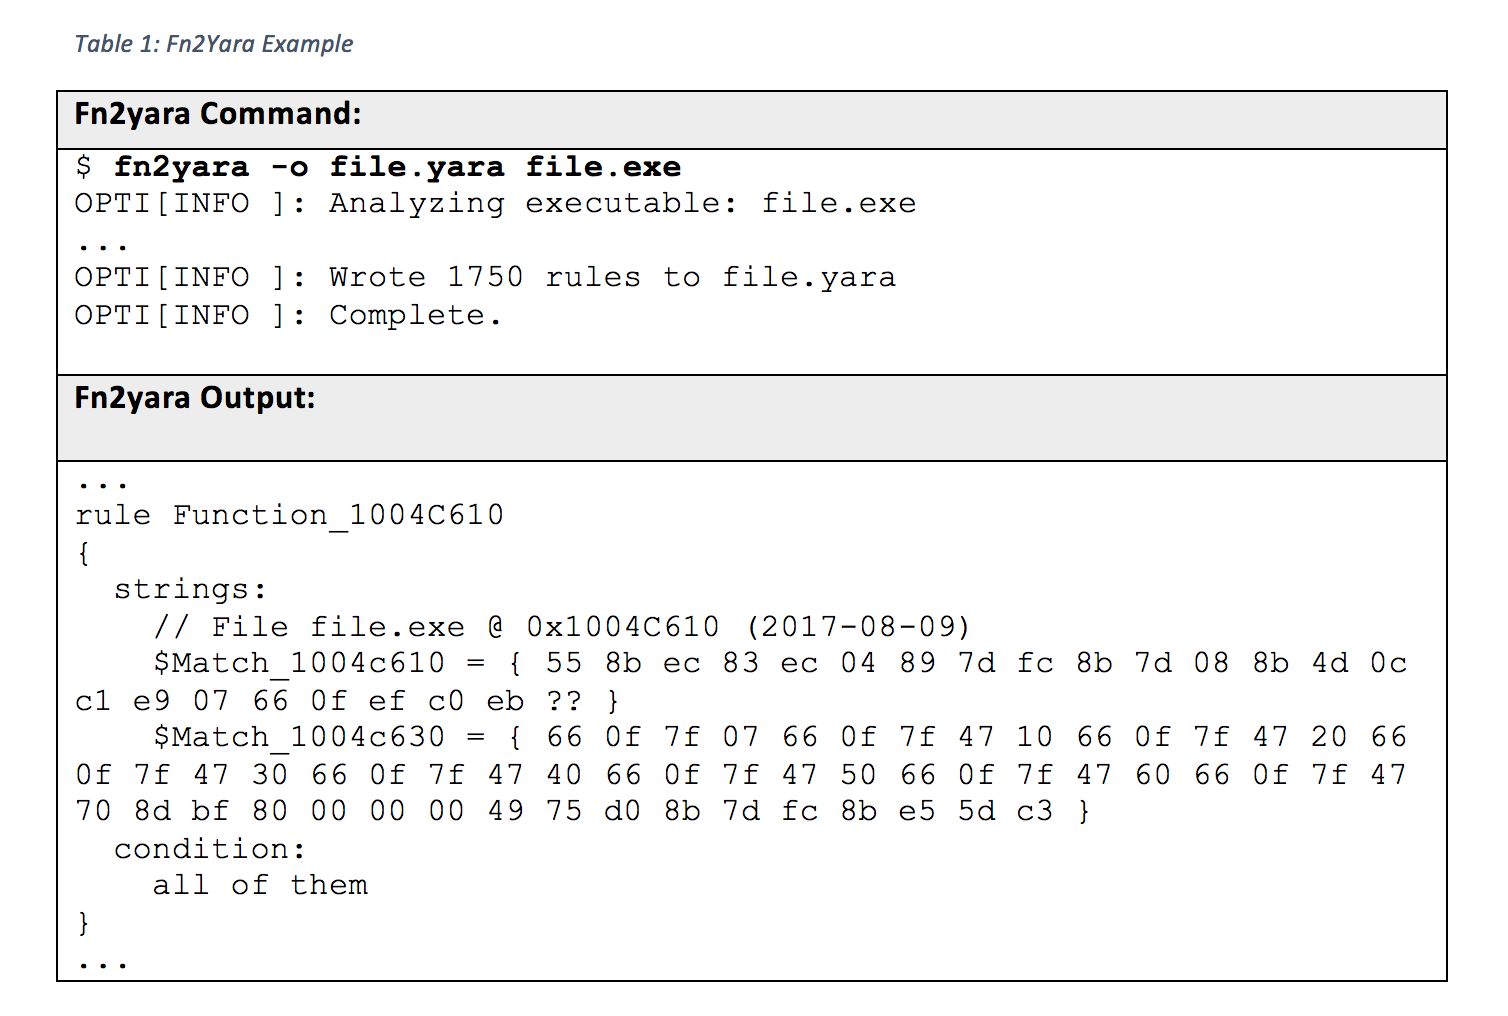
Analysts can use these rules to scan related files looking for similar or shared code.
Fn2Hash generates a variety of function hashes and metrics for each identified function in an executable. These hashes and metrics are listed in Table 2.
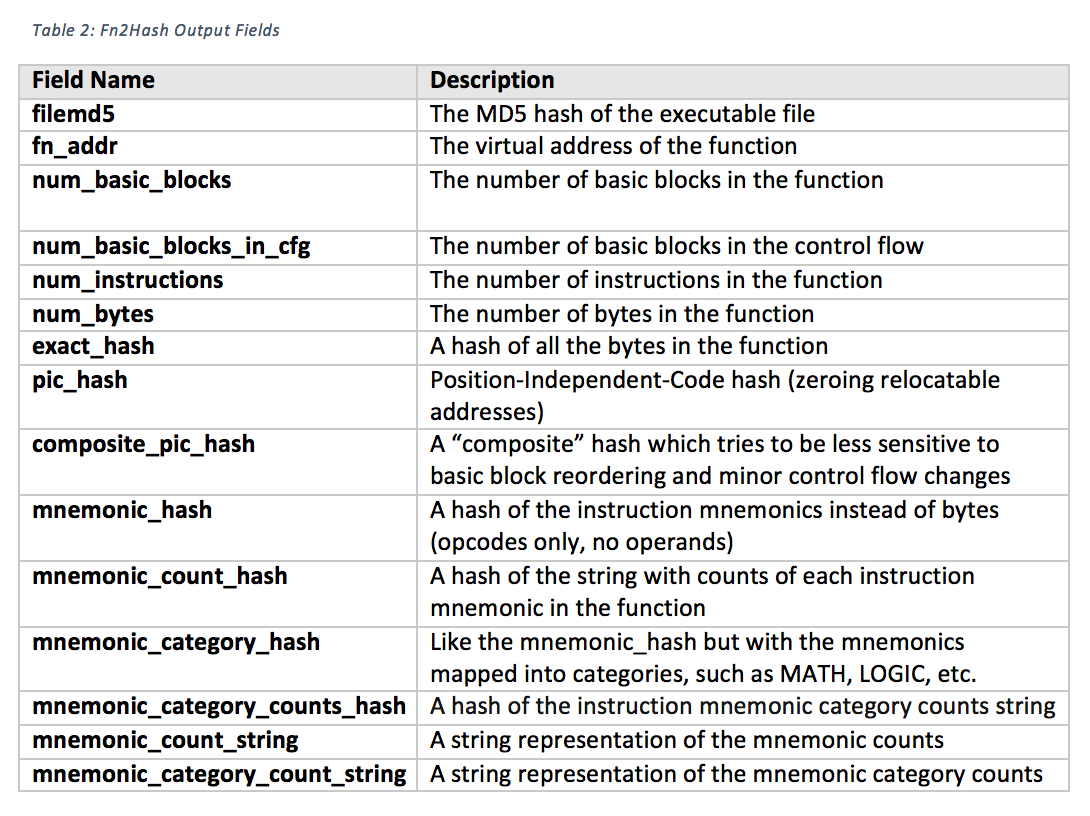
Fn2Hash output fields are comma separated, as is shown in the example Fn2Hash output (line breaks added):
4D4A3459FC445284076FE78D19487B74,0x00401000,4,4,18,47,
9B3FCDC8DC84156267316A6620ACDF7A,
5033E93997514ED561ECB5774AFB5D3F,92161D0EA30CBE1718C4DAA051097A2A,
BE459F274C813AE83AFAB58860F912F6,
CF6F7F6C3BEBB948A82E112102E5590C,
89C48D4A739B4B5ED1CC85C56A9FB4B2,2DE64015A9F24DBF3B03F51FAF4E0D33,
call:1;cmp:1;je:1;lea:1;mov:5;pop:1;push:7;ret:1,
BR:3;CMP:1;CRYPTO:0;FLT:0;I/O:0;LOGIC:0;MATH:1;SIMD:0;STR:0;SYS:0;UNCAT:0;VMM:0;XFER:13
ApiAnalyzer
Finally, the latest release of the Pharos tools includes our API pattern matching tool, called ApiAnalyzer. The capabilities provided by ApiAnalyzer enable reverse engineers and malware analysts to specify and then search for many potentially malicious API function call patterns of interest. In a previous post I detailed ApiAnalyzer's inner workings and API signature format. We included this tool and its source code in the Pharos repository to help analysts create new and interesting API-pattern signatures.
Looking Ahead
I've only scratched the surface of what is included the Pharos Static Analysis Framework. Future posts will examine in-depth our switch to a constraint-based approach to program analysis and our experiences using XSB Prolog. In the meantime, please download the tools and keep an eye on the Pharos GitHub repository and the SEI Insights blog for the latest updates to our work.
Additional Resources
Download Pharos Binary Analysis Framework and tools to support reverse engineering, which includes many new tools, improvements, and bug fixes.
Written By

Get updates on our latest work.
Sign up to have the latest post sent to your inbox weekly.
Subscribe Get our RSS feedGet updates on our latest work.
Each week, our researchers write about the latest in software engineering, cybersecurity and artificial intelligence. Sign up to get the latest post sent to your inbox the day it's published.
Subscribe Get our RSS feed