Measuring AI Accuracy with the AI Robustness (AIR) Tool


PUBLISHED IN
Artificial Intelligence EngineeringUnderstanding and evaluating your artificial intelligence (AI) system’s predictions can be challenging. AI and machine learning (ML) classifiers are subject to limitations caused by a variety of factors, including concept or data drift, edge cases, the natural uncertainty of ML training outcomes, and emerging phenomena unaccounted for in training data. These types of factors can lead to bias in a classifier’s predictions, compromising decisions made based on those predictions.
The SEI has developed a new free-to-use AI robustness (AIR) tool to help programs better understand and improve their AI classifier performance. In this blog post, we explain how the AIR tool works, provide an example of its use, and invite you to work with us if you want to use the AIR tool in your organization.
Challenges in Measuring Classifier Accuracy
There is little doubt that AI and ML tools are some of the most powerful tools developed in the last several decades. They are revolutionizing modern science and technology in the fields of prediction, automation, cybersecurity, intelligence gathering, training and simulation, and object detection, to name just a few. There is responsibility that comes with this great power, however. As a community, we need to be mindful of the idiosyncrasies and weaknesses associated with these tools and ensure we are taking these into account.
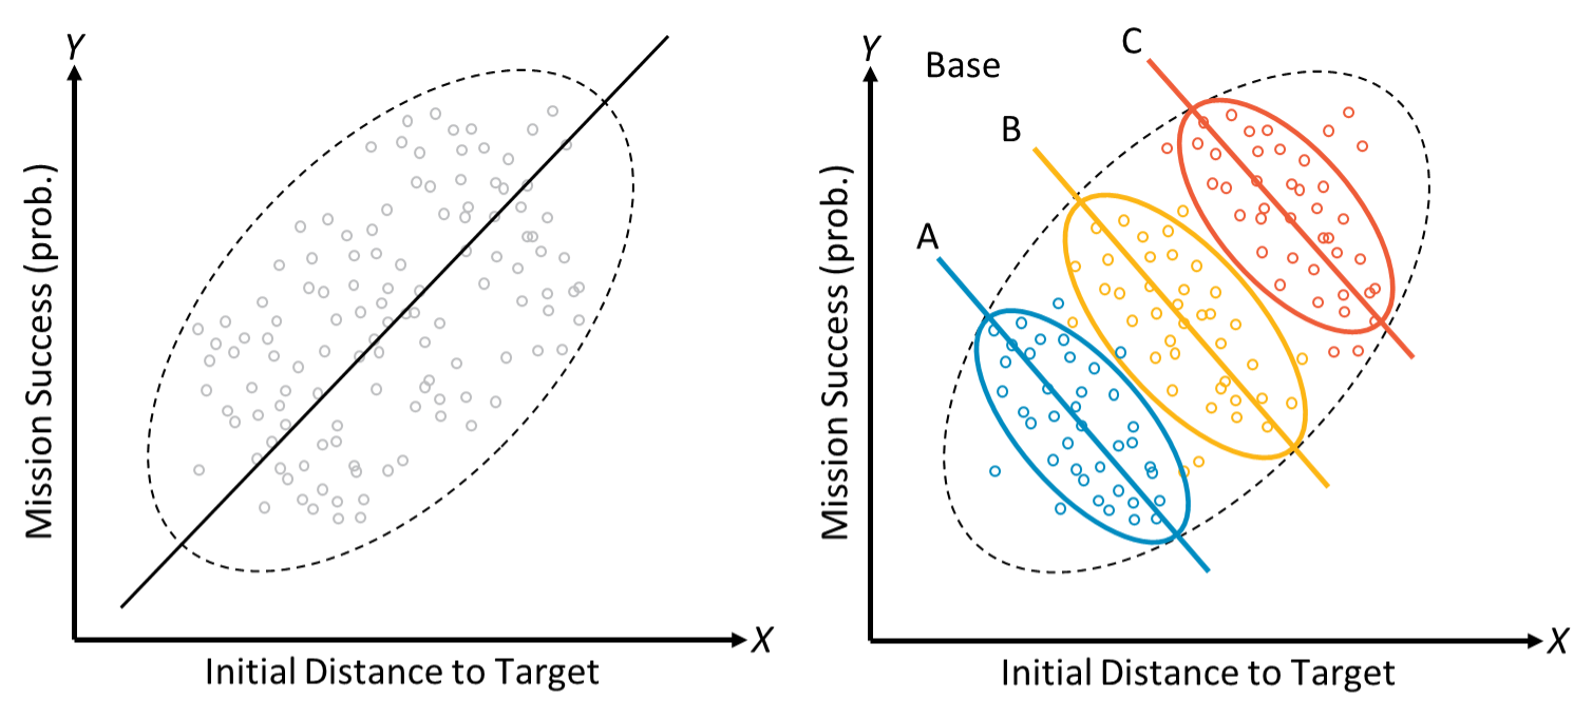
One of the greatest strengths of AI and ML is the ability to effectively recognize and model correlations (real or imagined) within the data, leading to modeling capabilities that in many areas excel at prediction beyond the techniques of classical statistics. Such heavy reliance on correlations within the data, however, can easily be undermined by data or concept drift, evolving edge cases, and emerging phenomena. This can lead to models that may leave alternative explanations unexplored, fail to account for key drivers, or even potentially attribute causes to the wrong factors. Figure 1 illustrates this: at first glance (left) one might reasonably conclude that the probability of mission success appears to increase as initial distance to the target grows. However, if one adds in a third variable for base location (the colored ovals on the right of Figure 1), the relationship reverses because base location is a common cause of both success and distance. This is an example of a statistical phenomenon known as Simpson’s Paradox, where a trend in groups of data reverses or disappears after the groups are combined. This example is just one illustration of why it is crucial to understand sources of bias in one’s data.
To be effective in critical problem spaces, classifiers also need to be robust: they need to be able to produce accurate results over time across a range of scenarios. When classifiers become untrustworthy due to emerging data (new patterns or distributions in the data that were not present in the original training set) or concept drift (when the statistical properties of the outcome variable change over time in unforeseen ways), they may become less likely to be used, or worse, may misguide a critical operational decision. Typically, to evaluate a classifier, one compares its predictions on a set of data to its expected behavior (ground truth). For AI and ML classifiers, the data originally used to train a classifier may be inadequate to yield reliable future predictions due to changes in context, threats, the deployed system itself, and the scenarios under consideration. Thus, there is no source for reliable ground truth over time.
Further, classifiers are often unable to extrapolate reliably to data they haven’t yet seen as they encounter unexpected or unfamiliar contexts that were not aligned with the training data. As a simple example, if you’re planning a flight mission from a base in a warm environment but your training data only includes cold-weather flights, predictions about fuel requirements and system health might not be accurate. For these reasons, it is critical to take causation into account. Knowing the causal structure of the data can help identify the various complexities associated with traditional AI and ML classifiers.
Causal Learning at the SEI
Causal learning is a field of statistics and ML that focuses on defining and estimating cause and effect in a systematic, data-driven way, aiming to uncover the underlying mechanisms that generate the observed outcomes. While ML produces a model that can be used for prediction from new data, causal learning differs in its focus on modeling, or discovering, the cause-effect relationships inferable from a dataset. It answers questions such as:
- How did the data come to be the way it is?
- What system or context attributes are driving which outcomes?
Causal learning helps us formally answer the question of “does X cause Y, or is there some other reason why they always seem to occur together?” For example, let’s say we have these two variables, X and Y, that are obviously correlated. Humans historically tend to look at time-correlated events and assign causation. We might reason: first X happens, then Y happens, so clearly X causes Y. But how do we test this formally? Until recently, there was no formal methodology for testing causal questions like this. Causal learning allows us to build causal diagrams, account for bias and confounders, and estimate the magnitude of effect even in unexplored scenarios.
Recent SEI research has applied causal learning to determining how robust AI and ML system predictions are in the face of conditions and other edge cases that are extreme relative to the training data. The AIR tool, built on the SEI’s body of work in casual learning, provides a new capability to evaluate and improve classifier performance that, with the help of our partners, will be ready to be transitioned to the DoD community.
How the AIR Tool Works
AIR is an end-to-end causal inference tool that builds a causal graph of the data, performs graph manipulations to identify key sources of potential bias, and uses state-of-the-art ML algorithms to estimate the average causal effect of a scenario on an outcome, as illustrated in Figure 2. It does this by combining three disparate, and often siloed, fields from within the causal learning landscape: causal discovery for building causal graphs from data, causal identification for identifying potential sources of bias in a graph, and causal estimation for calculating causal effects given a graph. Running the AIR tool requires minimal manual effort—a user uploads their data, defines some rough causal knowledge and assumptions (with some guidance), and selects appropriate variable definitions from a dropdown list.
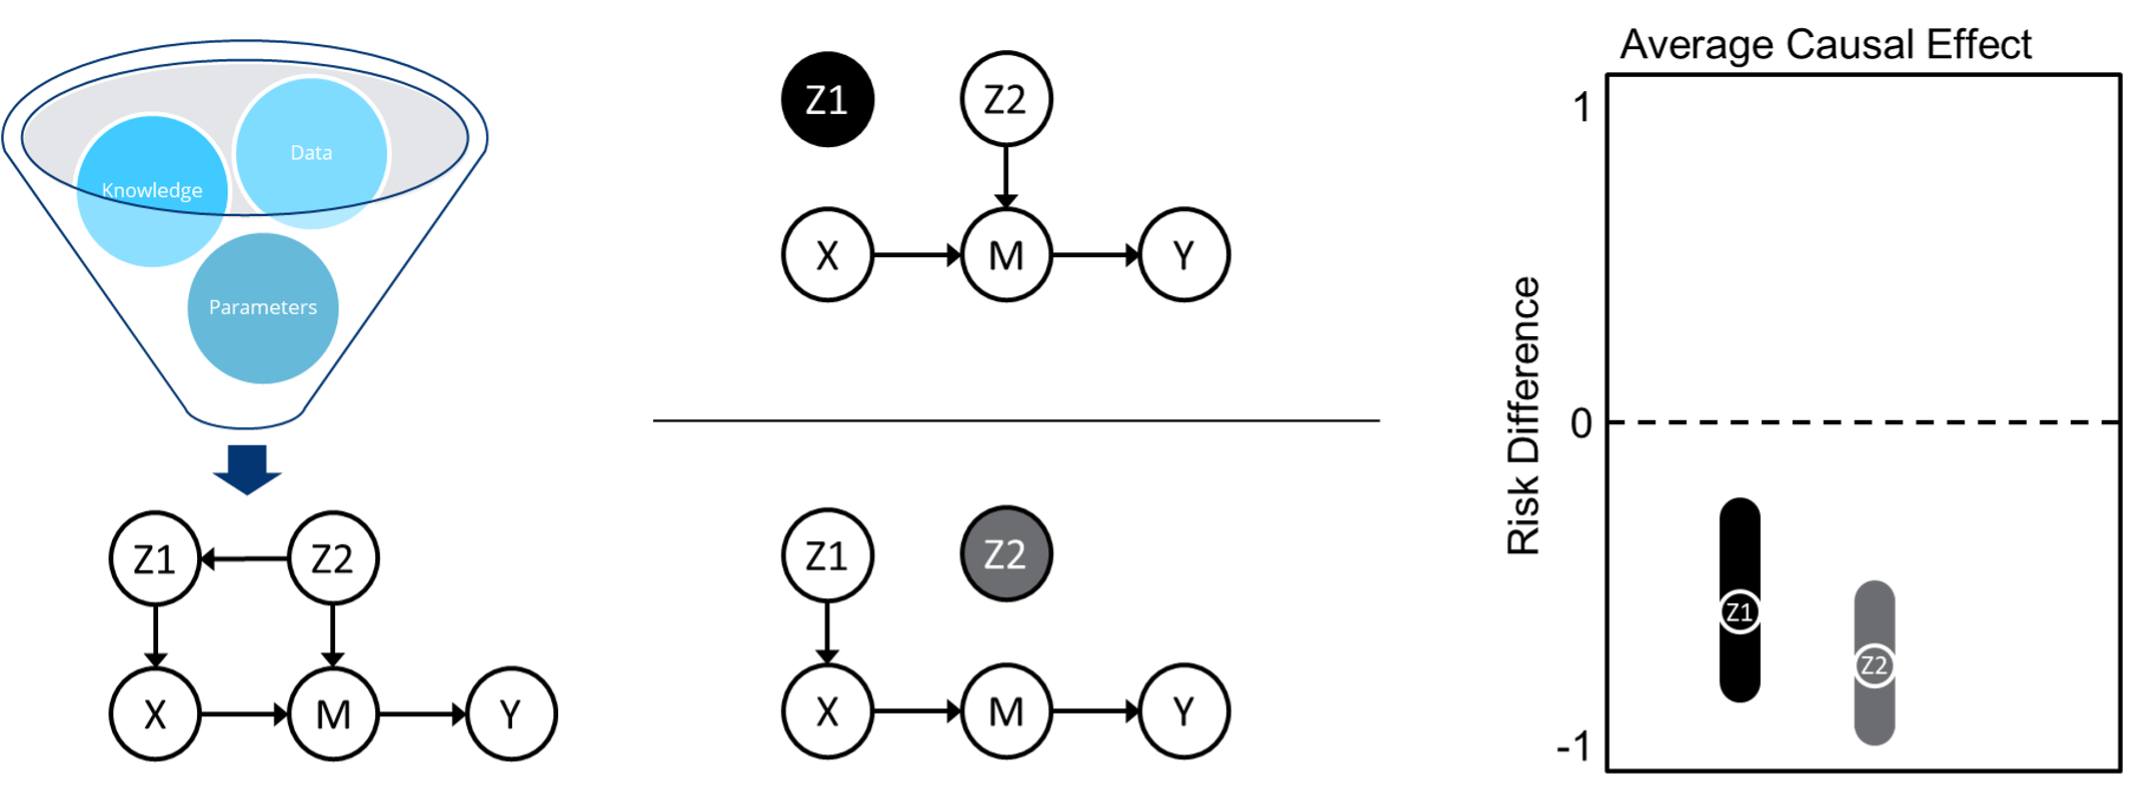
Causal discovery, on the left of Figure 2, takes inputs of data, rough causal knowledge and assumptions, and model parameters and outputs a causal graph. For this, we utilize a state-of-the-art causal discovery algorithm called Best Order Score Search (BOSS). The resulting graph consists of a scenario variable (X), an outcome variable (Y), any intermediate variables (M), parents of either X (Z1) or M (Z2), and the direction of their causal relationship in the form of arrows.
Causal identification, in the middle of Figure 2, splits the graph into two separate adjustment sets aimed at blocking backdoor paths through which bias can be introduced. This aims to avoid any spurious correlation between X and Y that is due to common causes of either X or M that can affect Y. For example, Z2 is shown here to affect both X (through Z1) and Y (through M). To account for bias, we need to break any correlations between these variables.
Finally, causal estimation, illustrated on the right of Figure 2, uses an ML ensemble of doubly-robust estimators to calculate the effect of the scenario variable on the outcome and produce 95% confidence intervals associated with each adjustment set from the causal identification step. Doubly-robust estimators allow us to produce consistent results even if the outcome model (what is probability of an outcome?) or the treatment model (what is the probability of having this distribution of scenario variables given the outcome?) is specified incorrectly.
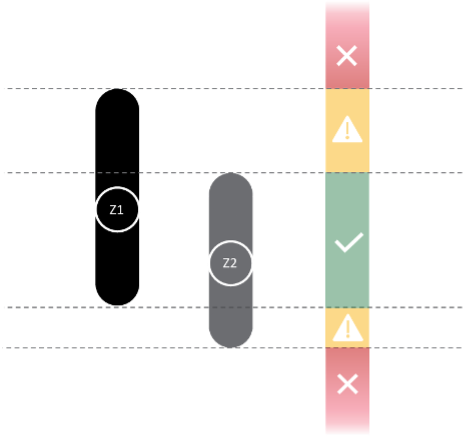
The 95% confidence intervals calculated by AIR provide two independent checks on the behavior, or predicted outcome, of the classifier on a scenario of interest. While it might be an aberration if only one set of the two bands is violated, it may also be a warning to monitor classifier performance for that scenario regularly in the future. If both bands are violated, a user should be wary of classifier predictions for that scenario. Figure 3 illustrates an example of two confidence interval bands.
The two adjustment sets output from AIR provide recommendations of what variables or features to focus on for subsequent classifier retraining. In the future, we’d like to employ the causal graph together with the learned relationships to generate synthetic training data for improving classifier predictions.
The AIR Tool in Action
To demonstrate how the AIR tool might be used in a real-world scenario, consider the following example. A notional DoD program is using unmanned aerial vehicles (UAVs) to collect imagery, and the UAVs can start the mission from two different base locations. Each location has different environmental conditions associated with it, such as wind speed and humidity. The program seeks to predict mission success, defined as the UAV successfully acquiring images, based on the starting location, and they have built a classifier to aid in their predictions. Here, the scenario variable, or X, is the base location.
The program may want to understand not just what mission success looks like based on which base is used, but why. Unrelated events may end up changing the value or impact of environmental variables enough that the classifier performance starts to degrade.
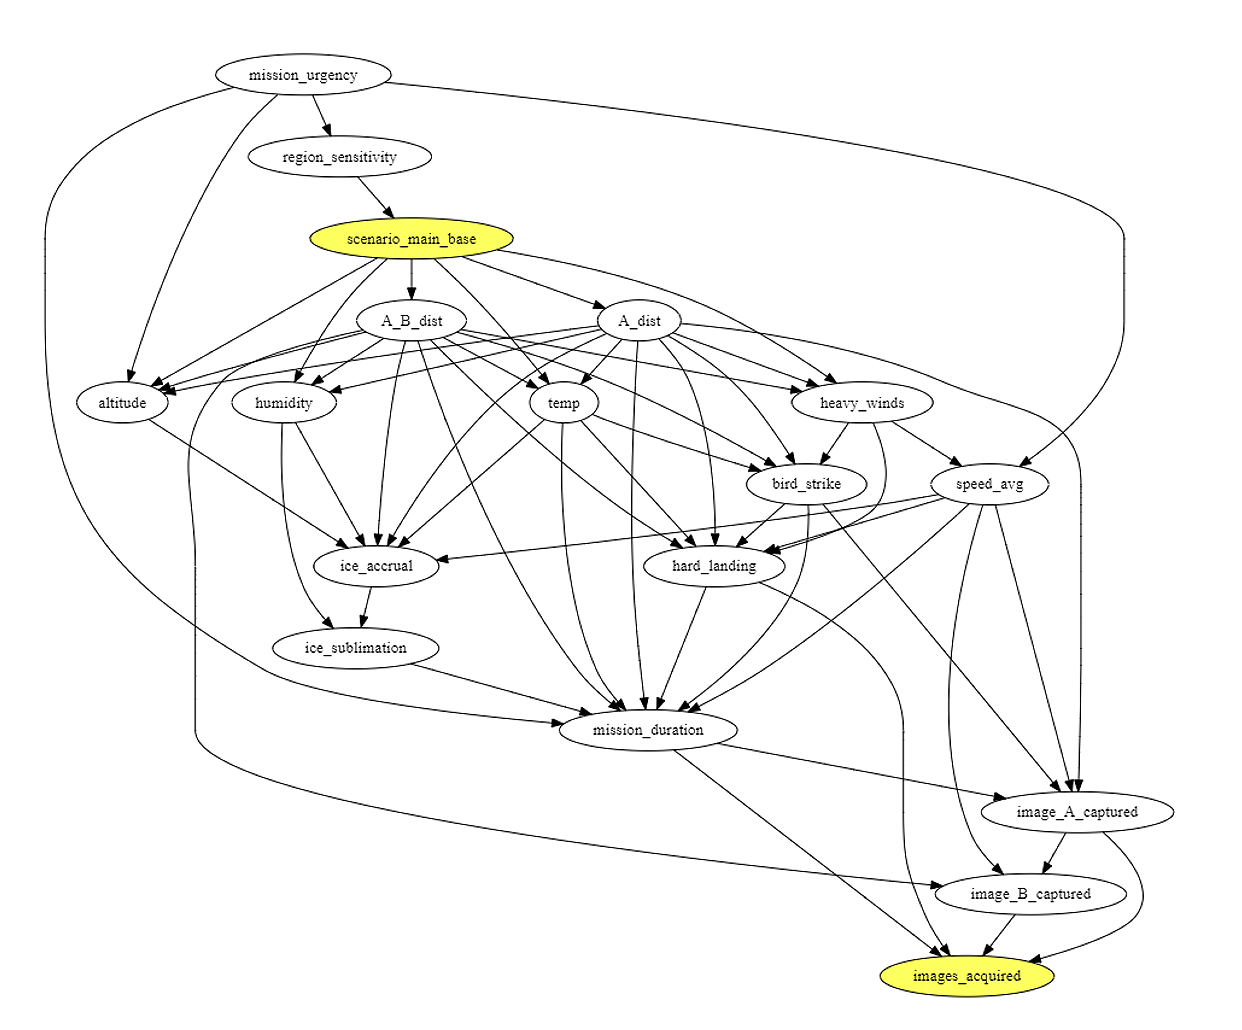
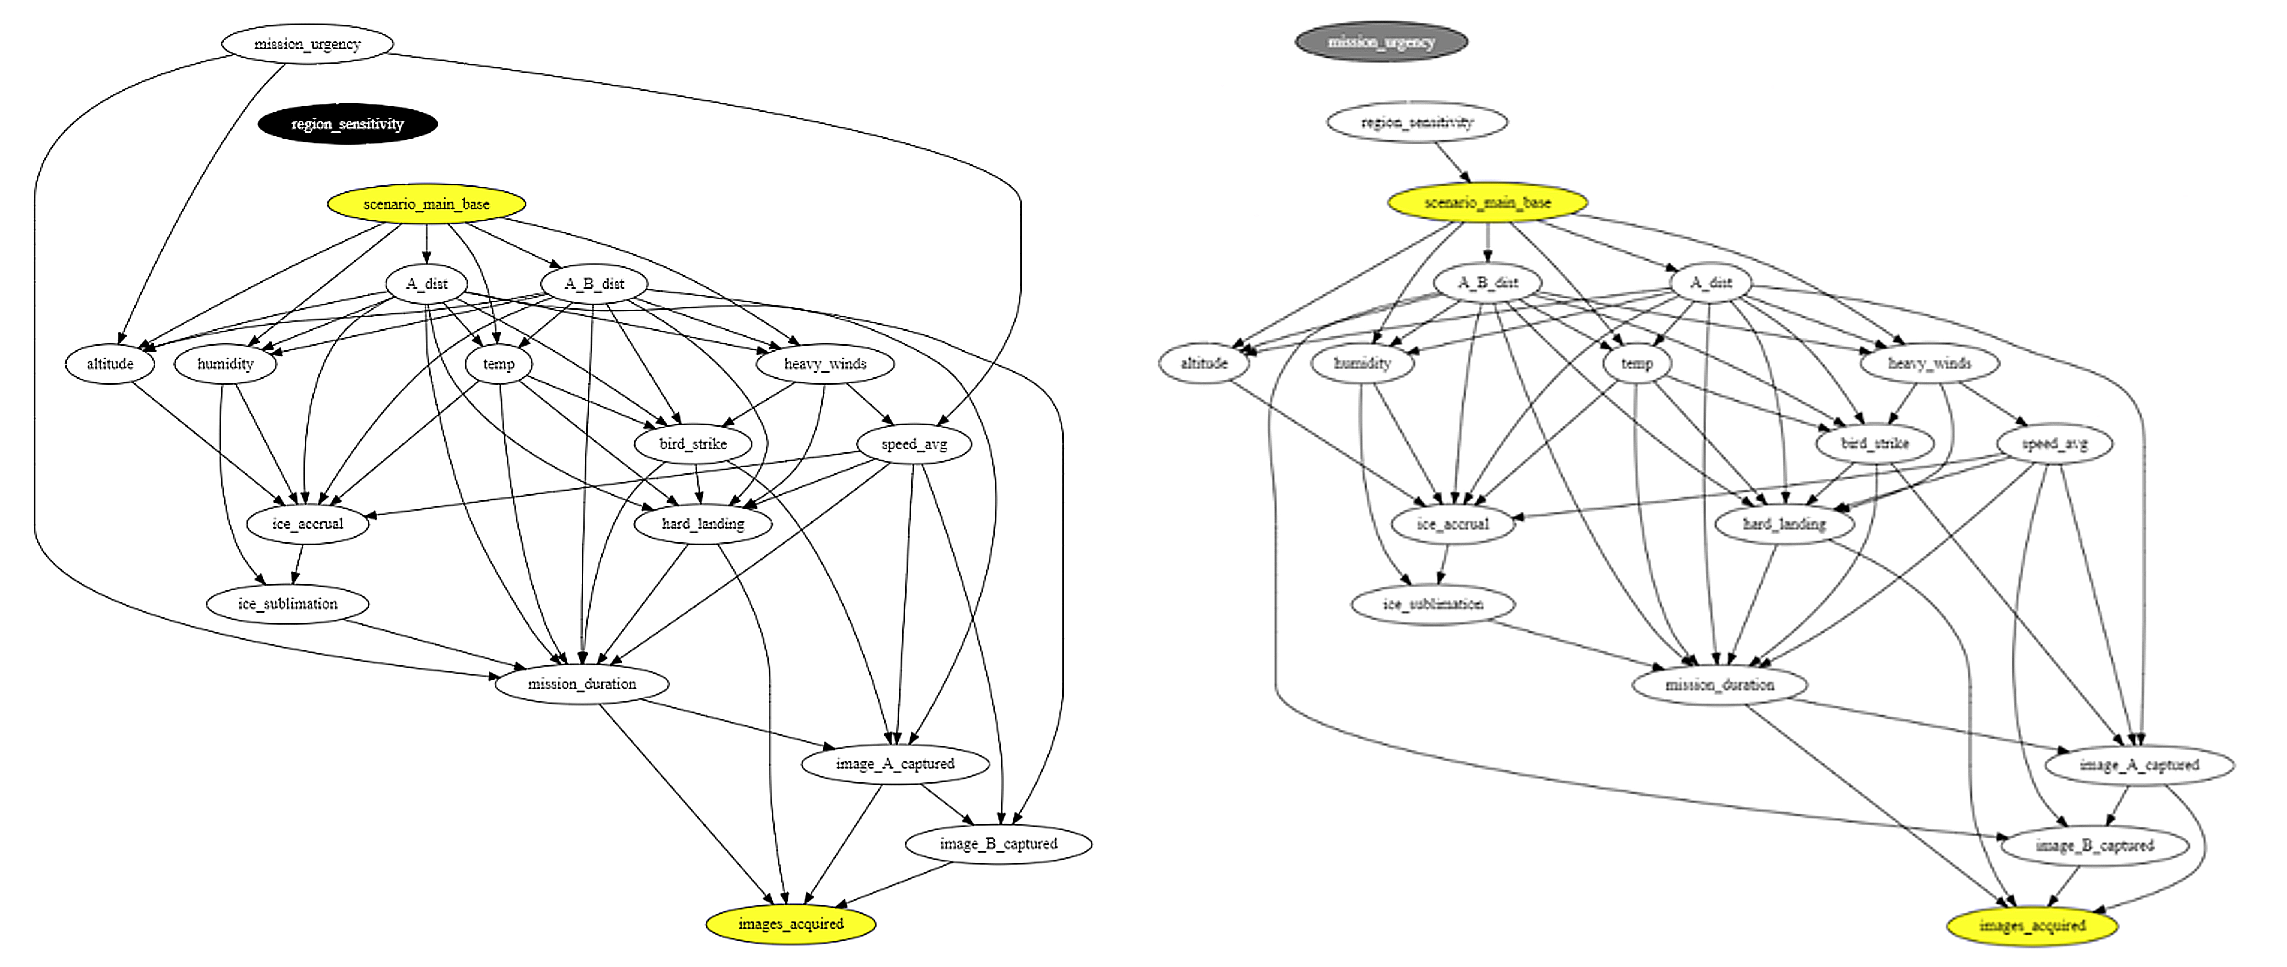
The first step of the AIR tool applies causal discovery tools to generate a causal graph (Figure 4) of the most likely cause-and-effect relationships among variables. For example, ambient temperature affects the amount of ice accumulation a UAV might experience, which can affect whether the UAV is able to successfully fulfill its mission of obtaining images.
In step 2, AIR infers two adjustment sets to help detect bias in a classifier’s predictions (Figure 5). The graph on the left is the result of controlling for the parents of the main base treatment variable. The graph to the right is the result of controlling for the parents of the intermediate variables (apart from other intermediate variables) such as environmental conditions. Removing edges from these adjustment sets removes potential confounding effects, allowing AIR to characterize the impact that choosing the main base has on mission success.
Finally, in step 3, AIR calculates the risk difference that the main base choice has on mission success. This risk difference is calculated by applying non-parametric, doubly-robust estimators to the task of estimating the impact that X has on Y, adjusting for each set separately. The result is a point estimate and a confidence range, shown here in Figure 6. As the plot shows, the ranges for each set are similar, and analysts can now compare these ranges to the classifier prediction.
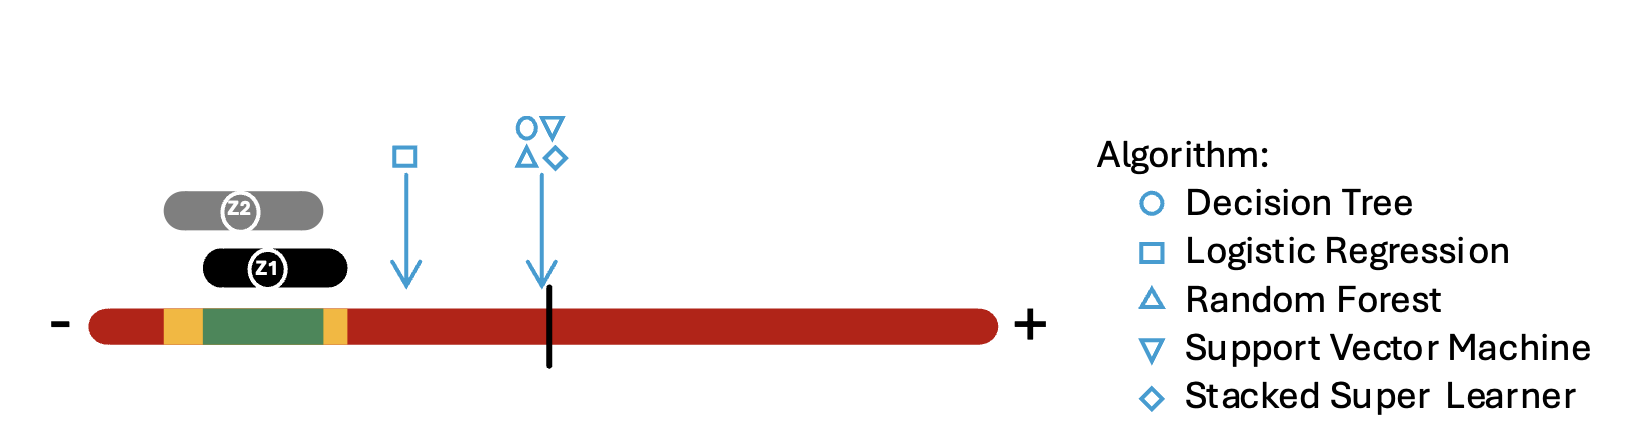
Figure 6 represents the risk difference associated with a change in the variable, i.e., scenario_main_base. The x-axis ranges from positive to negative effect, where the scenario either increases the likelihood of the outcome or decreases it, respectively; the midpoint here corresponds to no significant effect. Alongside the causally-derived confidence intervals, we also incorporate a five-point estimate of the risk difference as realized by five popular ML algorithms—decision tree, logistic regression, random forest, stacked super learner, and support vector machine. These inclusions illustrate that these problems are not particular to any specific ML algorithm. ML algorithms are designed to learn from correlation, not the deeper causal relationships implied by the same data. The classifiers’ prediction risk differences, represented by various light blue shapes, fall outside the AIR-calculated causal bands. This result indicates that these classifiers are likely not accounting for confounding due to some variables, and the AI classifier(s) should be re-trained with more data—in this case, representing launch from main base versus launch from another base with a variety of values for the variables appearing in the two adjustment sets. In the future, the SEI plans to add a health report to help the AI classifier maintainer identify additional ways to improve AI classifier performance.
Using the AIR tool, the program team in this scenario now has a better understanding of the data and more explainable AI.
How Generalizable is the AIR Tool?
The AIR tool can be used across a broad range of contexts and scenarios. For example, organizations with classifiers employed to help make business decisions about prognostic health maintenance, automation, object detection, cybersecurity, intelligence gathering, simulation, and many other applications may find value in implementing AIR.
While the AIR tool is generalizable to scenarios of interest from many fields, it does require a representative data set that meets current tool requirements. If the underlying data set is of reasonable quality and completeness (i.e., the data includes significant causes of both treatment and outcome) the tool can be applied widely.
Opportunities to Partner
The AIR team is currently seeking collaborators to contribute to and influence the continued maturation of the AIR tool. If your organization has AI or ML classifiers and subject-matter experts to help us understand your data, our team can help you build a tailored implementation of the AIR tool. The tool is free, and there is no charge for working with the SEI AIR team to learn about your classifiers’ performance and to help our ongoing research into evolution and adoption. Some of the roles that could benefit from—and help us improve—the AIR tool include:
- ML engineers—helping identify test cases and validate the data
- data engineers—creating data models to drive causal discovery and inference stages
- quality engineers—ensuring the AIR tool is using appropriate verification and validation methods
- program leaders—interpreting the information from the AIR tool
With SEI adoption support, partnering organizations gain in-house expertise, innovative insight into causal learning, and knowledge to improve AI and ML classifiers.
Additional Resources
Watch the webcast Can You Rely on Your AI? Applying the AIR Tool to Improve Classifier Performance.
Read the fact sheet Improve Your AI Classifiers with AIR Using Causal Discover, Identification, and Estimation.
Read the blog How Can Causal Learning Help to Control Costs?.
Read the recent blog 3 Recommendations for Machine Unlearning Evaluation Challenges.
Written By


More By The Authors
More In Artificial Intelligence Engineering
PUBLISHED IN
Artificial Intelligence EngineeringGet updates on our latest work.
Sign up to have the latest post sent to your inbox weekly.
Subscribe Get our RSS feedMore In Artificial Intelligence Engineering
Get updates on our latest work.
Each week, our researchers write about the latest in software engineering, cybersecurity and artificial intelligence. Sign up to get the latest post sent to your inbox the day it's published.
Subscribe Get our RSS feed