Enhancing Machine Learning Assurance with Portend


PUBLISHED IN
Artificial Intelligence EngineeringData drift occurs when machine learning models are deployed in environments that no longer resemble the data on which they were trained. As a result of this change, model performance can deteriorate. For example, if an autonomous unmanned aerial vehicle (UAV) attempts to visually navigate without GPS over an area during inclement weather, the UAV may not be able to successfully maneuver if its training data is missing weather phenomena such as fog or rain.
In this blog post, we introduce Portend, a new open source toolset from the SEI that simulates data drift in ML models and identifies the proper metrics to detect drift in production environments. Portend can also produce alerts if it detects drift, enabling users to take corrective action and enhance ML assurance. This post explains the toolset architecture and illustrates an example use case.
Portend Workflow
The Portend workflow consists of two stages: the data drift planning stage and the monitor selection stage. In the data drift planning stage, a model developer defines the expected drift conditions, configures drift inducers that will simulate that drift, and measures the impact of that drift. The developer then uses these results in the monitor selection stage to determine the thresholds for alerts.
Before beginning this process, a developer must have already trained and validated an ML model.
Data Drift Planning Stage
With a trained model, a developer can then define and generate drifted data and compute metrics to detect the induced drift. The Portend data drift stage includes the following tools and components:
Drifter—a tool that generates a drifted data set from a base data setPredictor—a component that ingests the drifted data set and calculates data drift metrics. The outputs are the model predictions for the drifted data set.
Figure 1 below gives an overview of the data drift planning stage.
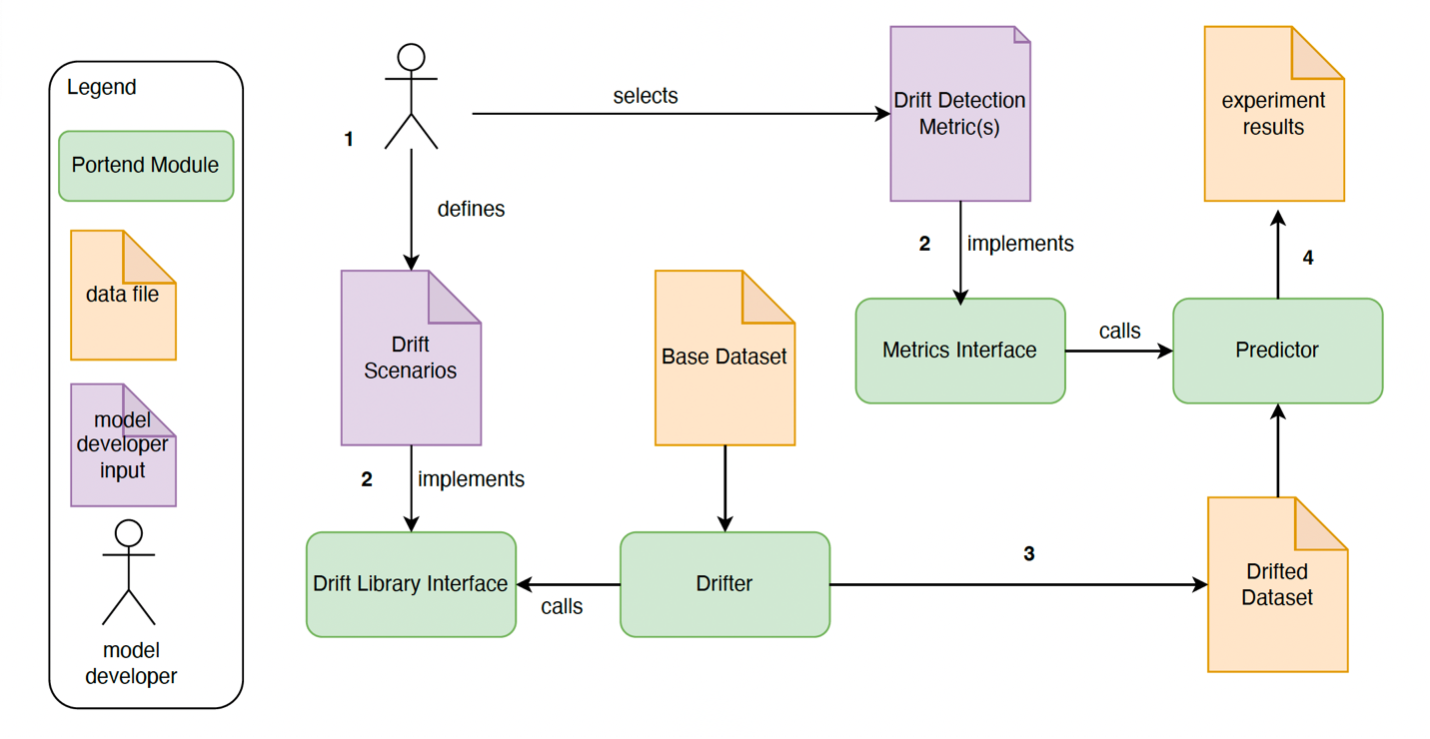
The developer first defines the drift scenarios that illustrate how the data drift is likely to affect the model. An example is a scenario where a UAV attempts to navigate over a known city, which has substantially changed how it is viewed from the air due to the presence of fog. These scenarios should account for the magnitude, frequency, and duration of a potential drift (in our example above, the density of the fog). At this stage, the developer also selects the drift induction and detection methods. The specific methods depend on the nature of the data used, the anticipated data drift, and the nature of the ML model. While Portend supports a number of drift simulations and detection metrics, a user can also add new functionality if needed.
Once these parameters are defined, the developer uses the Drifter to generate the drifted data set. Using this input, the Predictor conducts an experiment by running the model on the drifted data and collecting the drift detection metrics. The configurations to generate drift and to detect drift are independent, and the developer can try different combinations to find the most appropriate ones to their specific scenarios.
Monitor Selection Stage
In this stage, the developer uses the experimental results from the drift planning stage to analyze the drift detection metrics and determine appropriate thresholds for creating alerts or other kinds of corrective actions during operation of the system. The goal of this stage is to create metrics that can be used to monitor for data drift while the system is in use.
The Portend monitor selection stage includes the following tools:
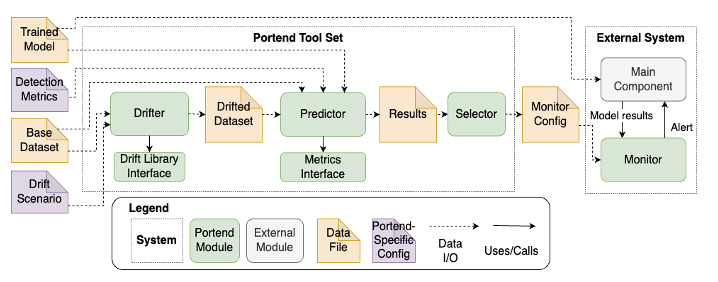
Selector—a tool that takes the input of the planning experiments and produces a configuration file that includes detection metrics and recommended thresholdsMonitor—a component that will be embedded in the target external system. TheMonitortakes the configuration file from theSelectorand sends alerts if it detects data drift.
Figure 2 below shows an overview of the entire Portend tool set.
Using Portend
Returning to the UAV navigation scenario mentioned above, we created an example scenario to illustrate Portend’s capabilities. Our goal was to generate a monitor for an image-based localization algorithm and then test that monitor to see how it performed when new satellite images were presented to the model. The code for the scenario is available in the GitHub repository.
To begin, we selected a localization algorithm, Wildnav, and modified its code slightly to allow for additional inputs, easier integration with Portend, and more robust image rotation detection. For our base dataset, we used 225 satellite images from Fiesta Island, California that can be regenerated using scripts available in our repository.
With our model defined and base dataset selected, we then specified our drift scenario. In this case, we were interested in how the use of overhead images of a known area, but with fog added to them, would affect the performance of the model. Using a technique to simulate fog and haze in images, we created drifted data sets with the Drifter. We then selected our detection metric, the average threshold confidence (ATC), because of its generalizability to using ML models for classification tasks. Based on our experiments, we also modified the ATC metric to better work with the kinds of satellite imagery we used.
Once we had the drifted data set and our detection metric, we used the Predictor to determine our prediction confidence. In our case, we set a performance threshold of a localization error less than or equal to five meters. Figure 3 illustrates the proportion of matching images in the base dataset by drift extent.
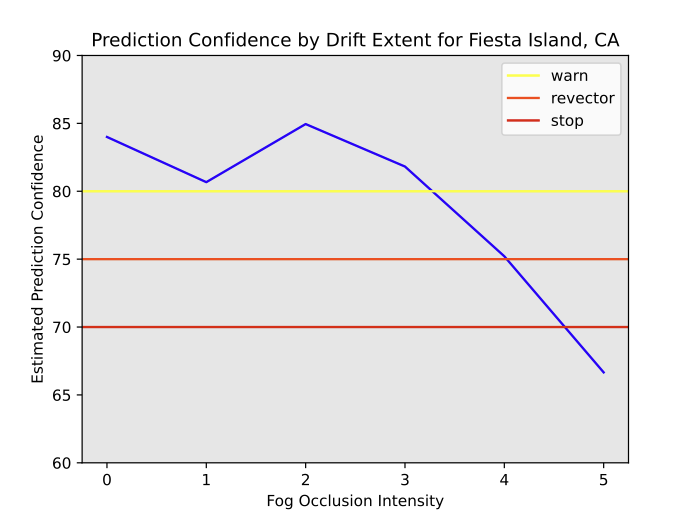
With these metrics in hand, we used the Selector to set thresholds for alert detection. In Figure 3, we can see three potential alert thresholds configured for this case, that can be used by the system or its operator to react in different ways depending on the severity of the drift. The sample alert thresholds are warn to just warn the operator; revector, to suggest the system or operator to find an alternate route; and stop, to recommend to stop the mission altogether.
Finally, we implemented the ATC metric into the Monitor in a system that simulates UAV navigation. We ran simulated flights over Fiesta Island, and the system was able to detect regions of poor performance and log alerts in a way that could be presented to an operator. This means that the metric was able to detect regions of poor model performance in an area that the model was not directly trained on and provides proof of concept for using the Portend toolset for drift planning and operational monitoring.
Work with the SEI
We are seeking feedback on the Portend tool. Portend currently contains libraries to simulate four time series conditions and image manipulation for fog and flood. The tool also supports seven drift detection metrics that estimate change in the data distribution and one error-based metric (ATC). The tools can be easily extended for overhead image data but can be extended to support other data types as well. Monitors are currently supported in Python and can be ported to other programming languages. We also welcome contributions to drift metrics and simulators.
Additionally, if you are interested in using Portend in your organization, our team can help adapt the tool for your needs. For questions or comments, email info@sei.cmu.edu or open an issue in our GitHub repository.
Additional Resources
Download Portend
Written By


More By The Authors
More In Artificial Intelligence Engineering
PUBLISHED IN
Artificial Intelligence EngineeringGet updates on our latest work.
Sign up to have the latest post sent to your inbox weekly.
Subscribe Get our RSS feedMore In Artificial Intelligence Engineering
Get updates on our latest work.
Each week, our researchers write about the latest in software engineering, cybersecurity and artificial intelligence. Sign up to get the latest post sent to your inbox the day it's published.
Subscribe Get our RSS feed