Mission Thread Analysis Using End-to-End Data Flows - Part 1

PUBLISHED IN
Cybersecurity EngineeringAlthough the vast majority of military missions require the successful collaboration of multiple cyber-physical systems within an overall system of systems (SoS), almost all system and software architects work on programs developing or sustaining individual systems and subsystems. Often, they do not sufficiently understand the ramifications of how their system interoperates with these other systems to accomplish the overall mission. The lack of an end-to-end (E2E) mission thread analysis leads to numerous difficulties, such as integration problems that are not identifiable if one merely looks at one's own system and the specifications of its individual interfaces.
This is the first post in a series on mission thread analysis using end-to-end data flows. This first post begins by listing engineering challenges caused by the lack of an E2E mission thread analysis. After discussing the concept of mission thread, I provide an overview of an effective way of addressing these challenges: the E2E Mission thread Data flow Analysis (EMDA) method. Specifically, I list its work products and give an example of its primary work product (the E2E data flow diagram).
Architecture Engineering Challenges
System, network, and software architects face many challenges when architecting their system within a system of systems:
- Size and complexity. A cyber-physical SoS is typically very large, being comprised of multiple systems that are themselves large and complex with many subsystems (both software and hardware). The subsystems are further composed of hardware and software configuration items (CIs) and line replaceable units (LRUs).
- Distributed Systems. The systems comprising an SoS are typically physically, even geographically, distributed. They are often connected by complex local area networks (LANs) and wide area networks (WANs) including various communications systems. To understand how data flows through the SoS and how data-in-transit are protected from cyberattack, architects and developers must therefore understand these networks including network devices such as switches, routers, firewalls, encryptors, and both line of sight (LOS) and beyond line of sight (BLOS) radios.
- Dispersed architectural representations. Architectural information is dispersed across numerous documents, diagrams, and the repositories of modeling tools. Some architectural decisions and rationales are never documented so that significant architectural information resides strictly in the minds of individual architects.
- Lack of visibility and control. Because the other systems in the SoS are developed and sustained by different program offices, prime contractors, and subcontractors, system and software architects, the architects usually have little insight into or control over the architecture of these systems. These system-development and sustainment projects are typically geographically distributed, making face-to-face discussions hard and expensive.
- Many architectures. Systems and SoSs have multiple architectures (e.g., hardware, software, network, and security) that vary over time (e.g., by build, block, and release) and often exist in multiple variants (e.g., air-based, land-based, sea-based, and space-based). These variants lead to inconsistencies that are easy to overlook. The architectures of the systems within the SoS are also different in terms of type (e.g., real-time vs. batch, monolithic vs. modular and open, and incorporating different infrastructure and interface technologies).
- Many architectural views. Architecture documentation, to the extent it exists, is composed of various types of representations: context diagrams, software diagrams, network diagrams, and sequence diagrams. These diagrams can be produced using different modelling languages, such as the DoD Architecture Framework (DODAF), System Modeling Language (SysML), Unified Modeling Language (UML), and Architecture Analysis and Design Language (AADL). They are stored in numerous forms such as in modeling tools, drawing tools (e.g., Visio and PowerPoint diagrams), Excel tables, MS Word documents, and hand-drawn diagrams on whiteboards. These views are also scattered across multiple program offices and contractors, making it very difficult to collect or gain access to the information needed to produce and document detailed mission threads, especially when there is no single canonical source of technical truth.
- Focus on static structure. Many architectural views focus on a system's static structure as opposed to its dynamic behavior. Architects and other developers often have a hard time seeing how the data (and control) flow through the software and hardware components and network devices to accomplish a specific mission thread. For example, sequence diagrams tend to be developed at a very high level of abstraction and do not show the majority of interactions below the subsystem level. Note that both data and control (i.e., commands) flow between components; although I will only use the term data flow for brevity's sake for the rest of this series of blog posts, I actually mean both the flow data flows and control flows.
- Fragmented, Inconsistent, and Incomplete Representations. Without a useful system model, the extent and complexity of end-to-end (E2E) data flows and control flows become a terra incognito. When different parts of a flow are on different diagrams, it is difficult to spot inconsistencies as well as missing components and interactions. Most architectural views address this problem by limiting themselves to narrow scopes that make it difficult to see how the different components collaborate to accomplish tasks.
- Verifying consistency. Because most architectural diagrams have different scopes, it is often hard to understand how they relate to each other. For example, hardware and software are typically represented on different diagrams using different diagramming notations. The deployment of software to hardware is often given in the form of an allocation table or hardware-specific lists. This presents an obstacle to understanding how data flow through the relevant architectural components to achieve a specific mission thread or use case.
The E2E Mission Thread Data Flow Analysis Method
An effective approach to addressing the preceding problems is to augment existing architecture engineering tasks with SoS-level E2E data flow analysis based on specific individual mission threads or paths through use cases. Both consist of sequences of interactions between architectural components and actions performed by these architectural components.
The E2E Mission Thread Data Flow Analysis (EMDA) method is clarified in the following three topics: work products produced, an example E2E data flow diagram (DFD), and the associated process used to produce the work products.
Mission Threads
As its name implies, the EMDA method is based on the concept of a mission thread. Because the term, mission thread, is often used loosely with multiple meanings, I will begin by clearly defining what it means in this series of blog postings.
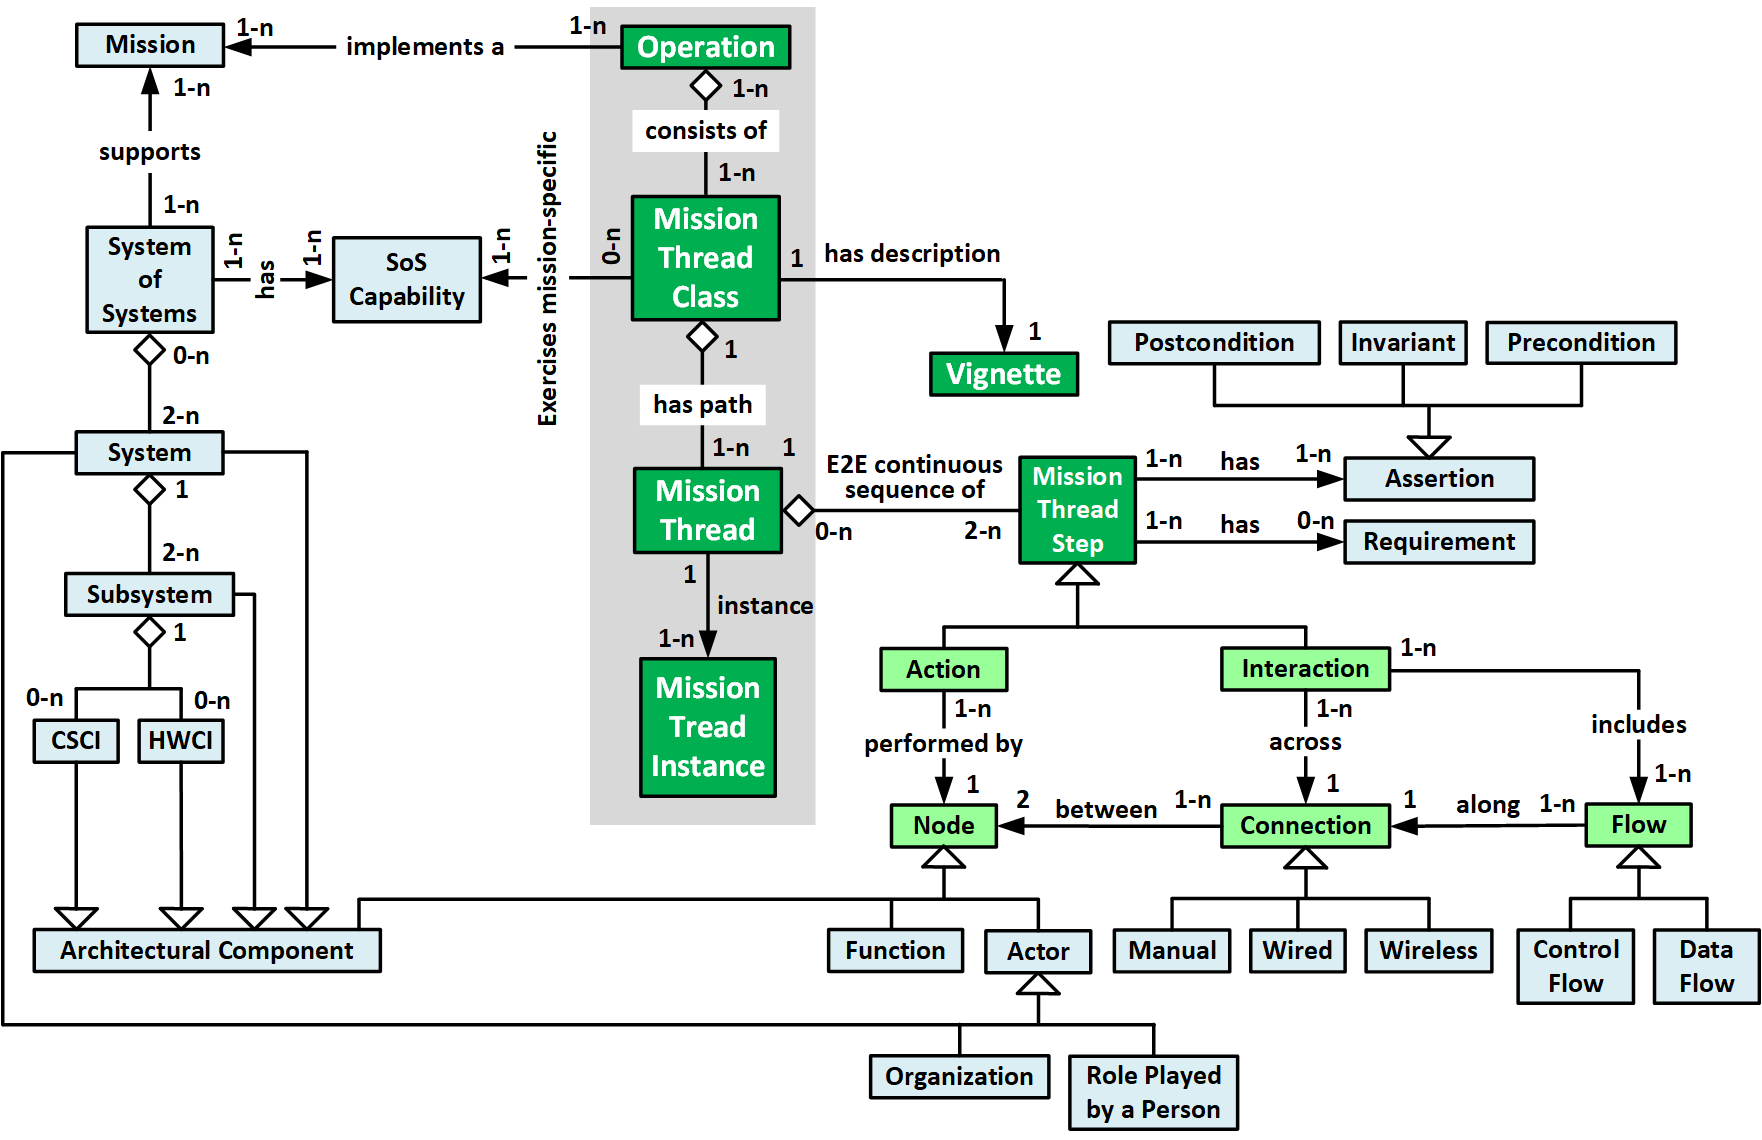
An individual mission thread is a single, contiguous, E2E sequence of interactions (i.e., data flows) between pairs of architectural components and actions performed by these architectural components. The components can be systems in the SoS, their subsystems, individual software and hardware configuration items (CIs), and line replaceable units (LRUs). Figure 1 documents a mission thread metamodel with mission-thread-specific concepts highlighted in green.
The concepts of mission thread and use case are similar but not identical. While use cases exist at the system-level, mission threads live at the SoS-level. Mission threads are analogous to use case flows (i.e., paths through a use case), and a mission thread can be thought of as an E2E sequence of use case paths. Similarly, specific concrete mission thread instances are analogous to specific usage scenarios. In both cases, mission threads and use case paths define equivalence classes of test cases (i.e., individual test cases that flow down the same path).
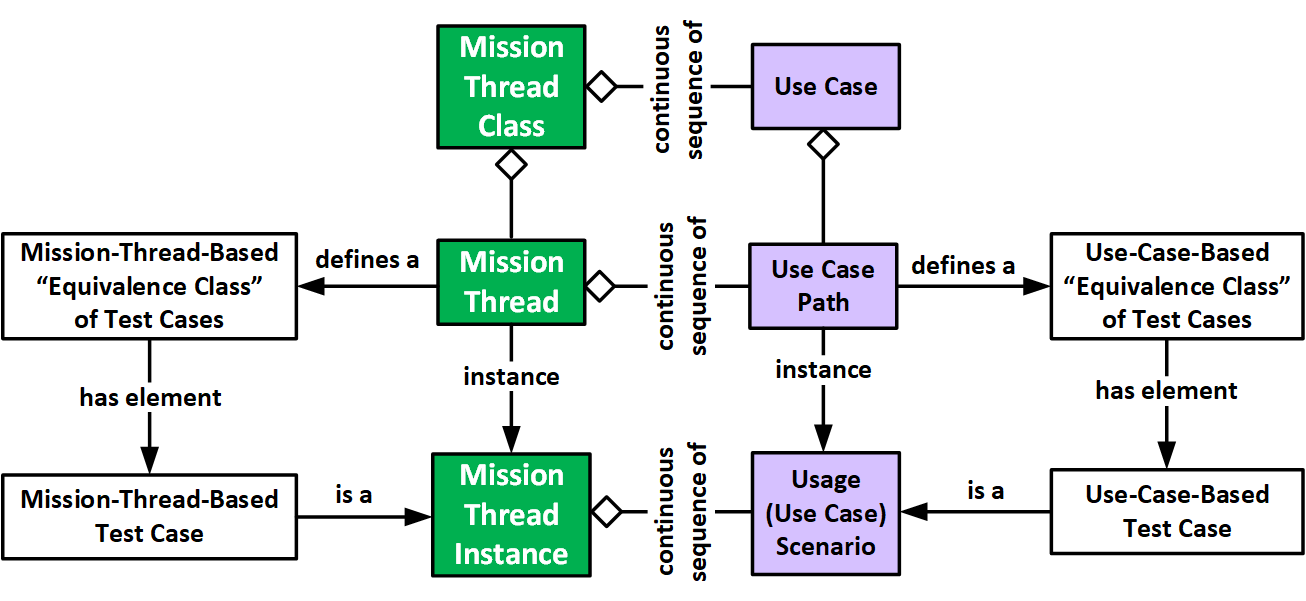
Figure 2: Comparison of Mission Threads and Use Cases
While sequence diagrams and swim lane diagrams are an effective way of documenting a use case, mission threads are much more complex because they model SoS behavior and address architectural components all the way down to individual CIs and LRUs. This increase in size and complexity is why sequence diagrams and swim lane diagrams do not scale well when applied to mission threads.
Work Products
SoS-level E2E data flow analysis requires the analyst(s) to develop the following five types of work products, listed roughly in order of development:
- Subject matter expert (SME) contact list. To obtain the information required for E2E data flow analysis, the analyst(s) must talk to a large number of people from multiple organizations and projects. It is therefore important to develop a contact list for these SMEs and stakeholders (especially those who would authorize contact with SMEs). The analyst(s) should augment the contact list with brief descriptions (project, system, subject area) and dates of contacts (i.e., phone, email, and in-person interviews).
- Source documentation list. This list--along with additional copies that should be read, highlighted, and marked up--should include all source documents including name, description, version/date, and location (e.g., the project's SharePoint site and modeling tool).
- SME interview notes. Keep notes of key inputs, not only to drive the development of the E2E DFDs, but also to help the modeler address inconsistent inputs from different SMEs.
- E2E data flow diagrams. These are the critical work products; the preceding work products are merely a means to this end. The nodes on these diagrams include all relevant architectural components (i.e., hardware and software configuration items, subsystems, and systems). Arrows between the nodes highlight relevant communication pathways as well as the direction and name of the data that flow between them. The data flows are numbered to illustrate the sequence of interactions between the components. Nesting and color are used to show aggregation relationships. Finally, colors can be used to signify security-related components (e.g., firewalls, encryptors, and intrusion detection systems) and interactions (e.g., flows that are protected by encryption, hash codes for integrity, or digital signatures). These diagrams would be stored in the project's architectural model database and included in the appropriate system and software architecture documents.
- Presentation/report. The analyst(s) prepares a short presentation to give to project management and key technical leaders providing the results of the modeling effort.
Example SoS-Level Mission Thread E2E Data Flow Diagram
As an example, consider the following two fictional system development programs. One program is developing an autonomous vehicle, such as a UAV, unmanned surface vehicle, or lunar rover. The other is developing its control system, which is located on a platform, such as an aircraft, ship, or space station. As shown in Figure 3, an unmanned vehicle's operator sitting at an operator console learns that the vehicle's mission plan needs to be updated (e.g., because of a change in mission, new threat data, changing weather conditions, or a change in the platform's course).
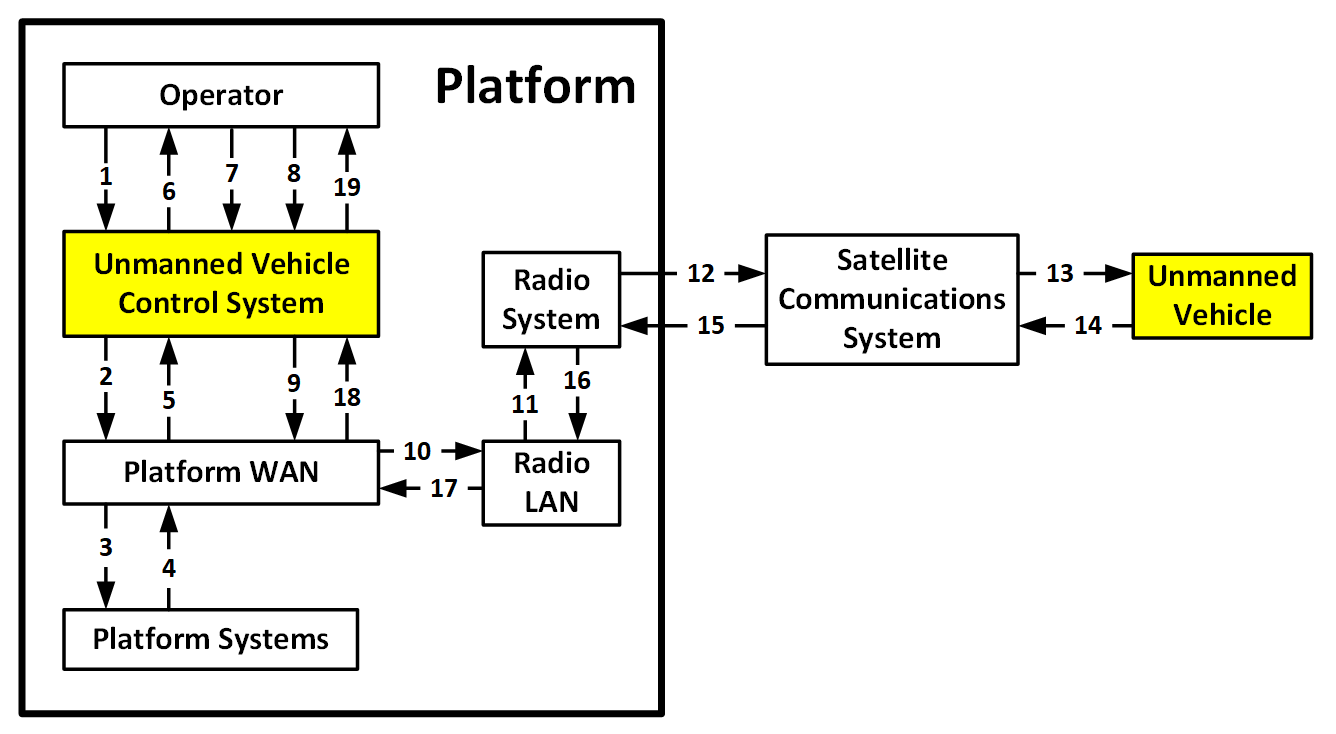
Figure 3: Example High-level E2E Data Flow Diagram
Figure 3 also shows how the vehicle operator uses the control system to send an information request via the platform WAN to the relevant platform systems (see Figure 3, arrows 1-3) to obtain weather data, threat data, etc. The requested information flows back to the vehicle operator (arrows 4-6), who updates the mission plan (arrow 7). The operator then uses the control system to send the updated mission plan to the radio system via the platform WAN and the radio LAN (arrows 8-11). Since the unmanned vehicle is beyond line of sight or range from the platform, a satellite radio transmits the updated mission plan via a satellite communication system to the unmanned vehicle (arrows 12-13). The unmanned vehicle acknowledges receipt of the new mission plan (arrows 14-19).
The top-level E2E data flow diagram in Figure 3 summarizes the example mission thread at the SoS level. However, it grossly under-identifies the number of architectural components and message hops between components that are required to implement the mission thread. Except for the human operator, each of the nodes in Figure 1 would include numerous smaller nodes.
For example, the systems could be decomposed into subsystems, which in turn would be decomposed into smaller subsystems and software configuration items deployed onto hardware configuration items such as different blades within a server rack. Similarly, the WAN and LAN could be decomposed into network switches, routers, firewalls, and encryptors. Figure 3 is therefore at such a high-level of abstraction that it provides little value with regard to analyzing the performance, robustness, safety, and security ramifications of the overall SoS architecture.
Clearly, a more detailed E2E DFD is needed, one that shows how data (and control) flows through the relevant components of the individual systems. Figure 4 shows what such a detailed diagram might look like. Note that because such a detailed diagram contains sensitive information that could be used by an adversary to attack an SoS, the following diagram is strictly notional and has no relationship to Figure 3.
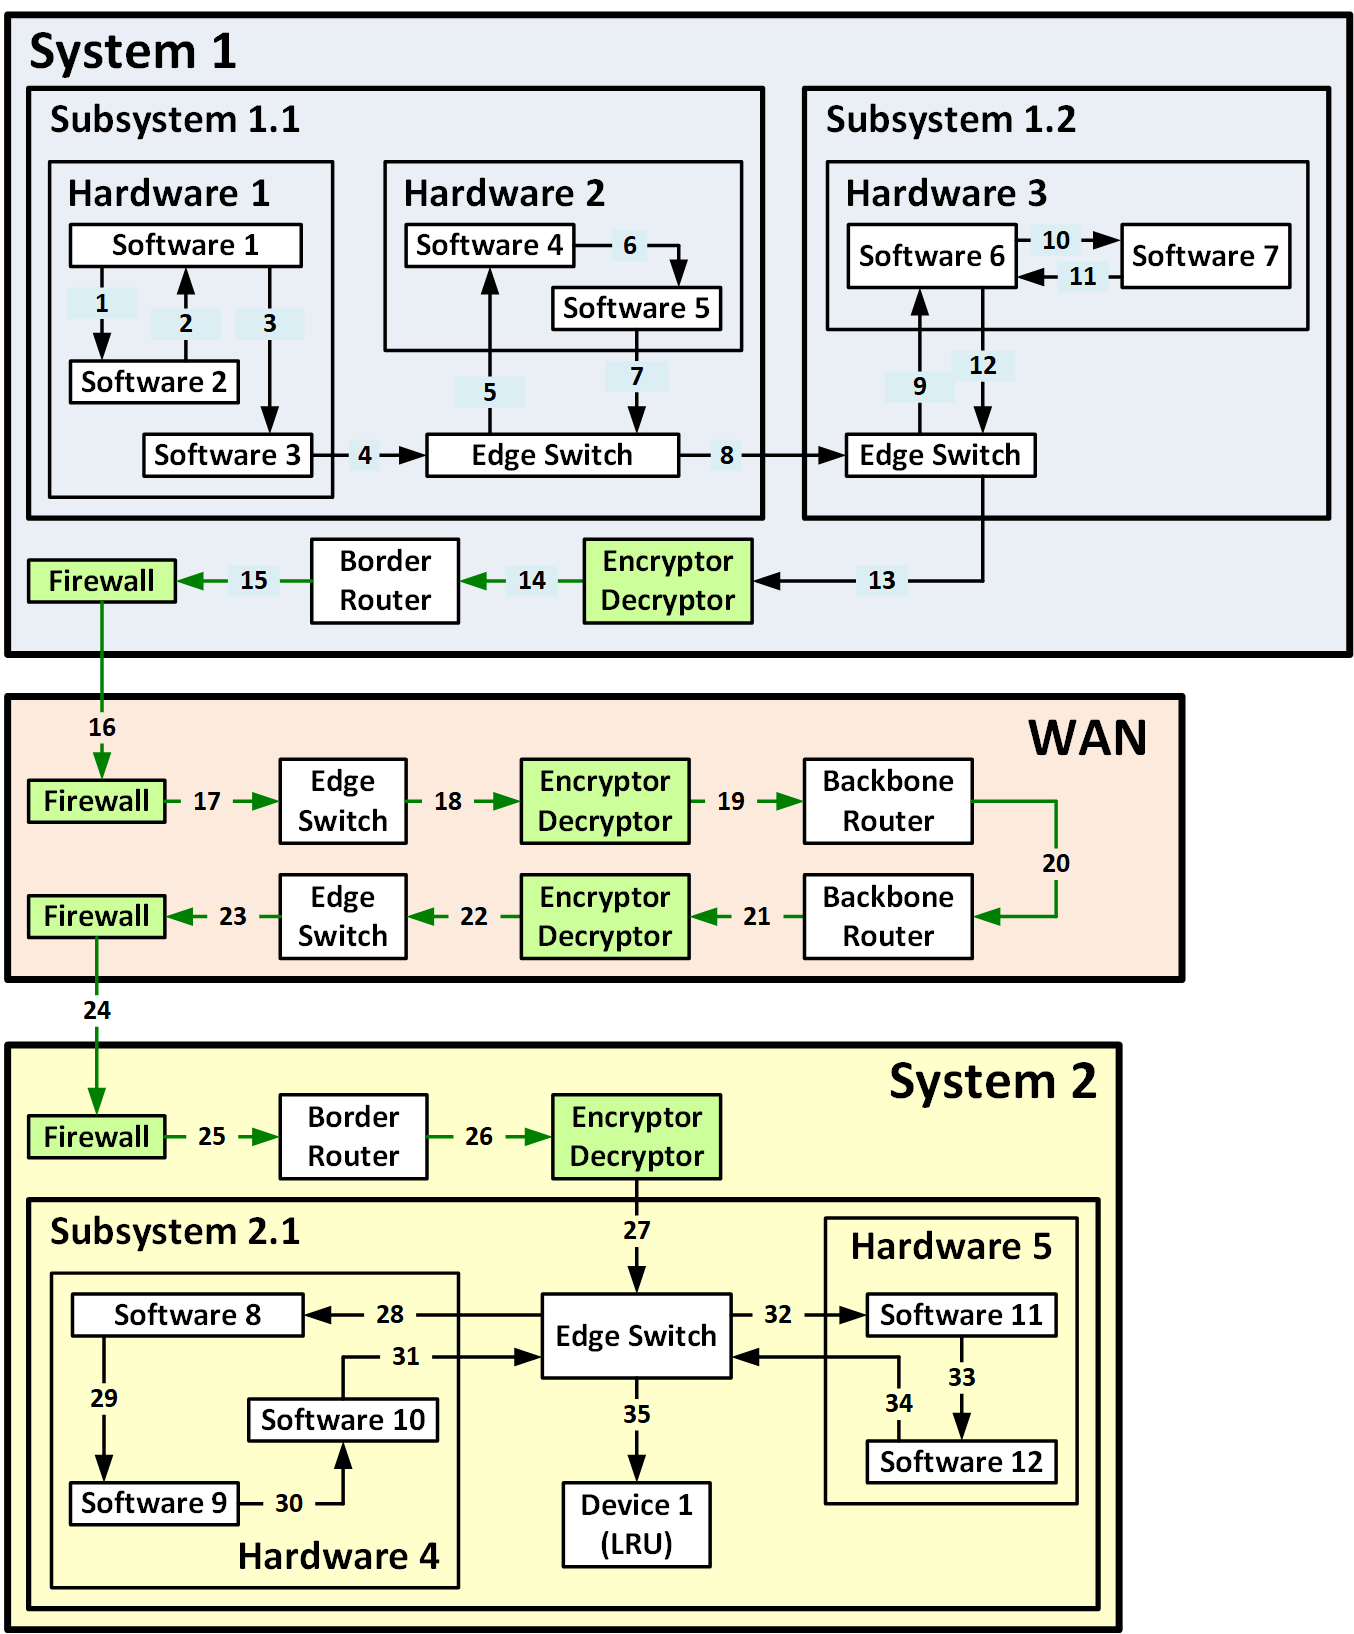
Figure 4: Example Notional Detailed E2E DFD
An actual E2E DFD is a valuable tool for cybersecurity analysis. In Figure 2 for example, green is used to indicate security components (e.g., encryptors and firewalls) as well as the data flows protected by encryption, digital signatures, and hash codes. On an actual diagram, the specific network devices and encryptors would be identified and annotated. For example, it might show multiple levels of encryption and decryption to protect data in transit, provide packet-level encryption for communications security (COMSEC), provide bulk encryption for transmission security (TRANSEC), and provide adequate cybersecurity defense in depth.
In real life, the resulting E2E DFD would be relatively large and complex, potentially involving more than 50 hops between nodes. Since an adversary could potentially attack any node or arc in the diagram, they represent potential parts of the overall attack surface of the SoS. For this reason alone, an actual E2E DFD would be highly sensitive; it might be labeled For Official Use Only (FOUO) and might even be classified. The sensitive nature of these diagrams is the primary reason that I have not provided a more complete example in this blog post.
Wrapping Up and Looking Ahead
Starting with the architecture engineering challenges it was developed to address, this blog post has provided an overview of the E2E Mission Thread Data Flow Analysis (EMDA) method including its work products and the process used to create and verify them. The next blog post in this series will discuss the benefits of the method, challenges that need to be addressed while implementing the method, and lessons that were learned during the use of this method on a US military program.
Additional Resources
View the webinar Mission Threads: Bridging Mission and Systems Engineering.
Read the SEI Technical Report, Introduction to the Mission Thread Workshop.
Written By

More By The Author
More In Cybersecurity Engineering
PUBLISHED IN
Cybersecurity EngineeringGet updates on our latest work.
Sign up to have the latest post sent to your inbox weekly.
Subscribe Get our RSS feedMore In Cybersecurity Engineering
Get updates on our latest work.
Each week, our researchers write about the latest in software engineering, cybersecurity and artificial intelligence. Sign up to get the latest post sent to your inbox the day it's published.
Subscribe Get our RSS feed