GeoIP in Your SOC (Security Operations Center)

Hi, this is Vijay Sarvepalli, Security Solutions Engineer in the CERT Program. Today, whether you're shopping for a new house or trying to find a babysitter, you end up using Google maps or a similar service to assist your decision making. In this blog post, I discuss GeoIP capabilities that can be built into your SOC to provide a spatial view of your network threats and how this view can help your network situational awareness.
On a late Friday night, one of my friends who is a senior systems administrator at an ISP told me about a large DDOS (Distributed Denial of Service) attack against his company's web servers. The DDOS was starting to bog down his web server and a number of network resources. Abandoning my promise to get home early, I started digging into this incident and found it was a well-distributed denial of service. A completely random set of IP addresses were flooding the network with a random POST request on the root directory (see sample apache log below):
XX.XX.251.19 - - [29/Sep/2012:03:10:05 -0500] "POST /?ptrxcz_YYYYYZZZZZZZaaaaaaabbbbbbbbccc HTTP/1.1" 301 271
The more I analyzed the problem, the more interesting it became. My initial analysis found that the attack involved about 1.3 million IP addresses. I went down the path of researching these networks and found that 19,637 unique class B (/16 subnet) networks were involved in the attack. After searching through ASNs (Autonomous System Numbers) of these attacking networks, I found that 15,723 unique ASNs were involved in the attack. Each web request had its own unique properties at both the packet level and application level (unique User-Agent strings for example).
I reached out to my colleague Evan Wright, a security analyst, to help solicit ideas to process this data. The more we talked, the more it became clear that my network situational awareness could benefit from a geospatial perspective. I quickly began using MaxMind's open-source GeoIP data to analyze the latitude and longitude geospatial locations of these IP addresses. Over 33,500 unique locations were represented, however there were concentrations of the attackers' geospatial locations.
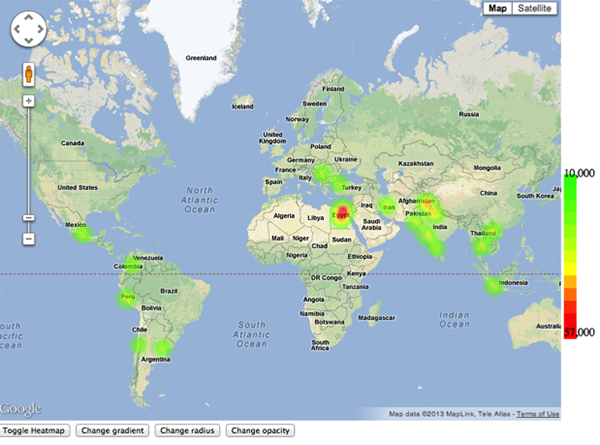
Evan whipped up a quick heat map of the attacker's network; soon enough we had a different view of the attack. The attackers almost exclusively were in developing countries. The highest concentration of attackers was in Egypt and its neighboring countries. There were also substantial concentrations of attackers in India, Thailand, Venezuela, and parts of Argentina.
Here is a modified version of that heat map:
I presented this information back to my friend at the ISP who was able to build a black hole for certain groups of networks and minimize the impact of the attack. Like most ISPs that don't have enterprise-level tools, the ISP benefited from a SOC geospatial view of the situation. The ISP was able to further investigate and discover possible attribution for this attack. While the attack is still ongoing (see recent sample logs below), the ISP can now gain a geospatial understanding of this attack and work towards mitigation.
XX.XX.212.118 - - [15/Apr/2013:09:27:10 -0500] "POST /?ptrxcz_9CEGJLNPSTVYacegjloqsuwz13579B HTTP/1.1" 301 271
After experience with this attack, I have built a few more tools that can be present in a SOC to help visualize and use GeoIP data to better assist the analysis of network threats. These tools include the following:
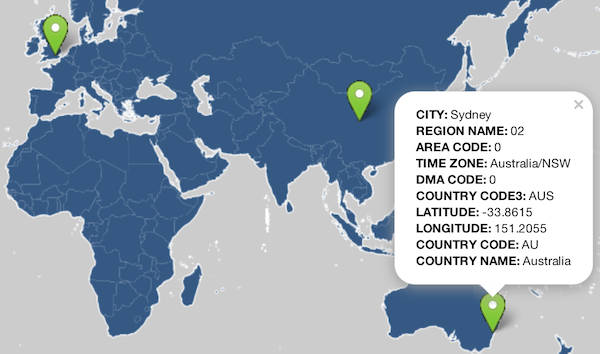
- A simple GeoIP plotter that displays markers on a map to identify IP addresses. Simply plot an IP address and drill down on details of an IP address as shown below:
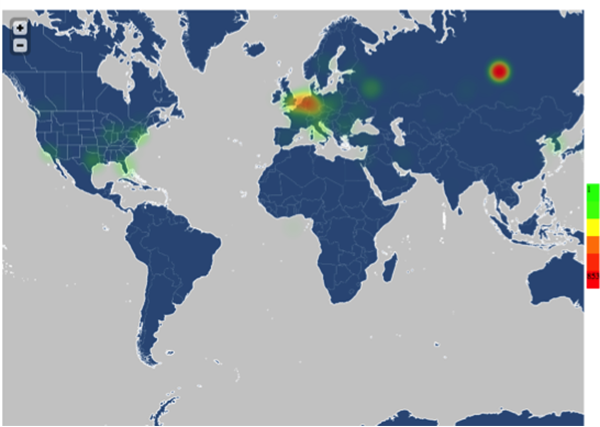
- A heat-map tool that can build a heat map of large set of IP addresses. The heat map below shows a recent DDOS attack on Spamhaus from open resolvers:
- A simulated heat-map that can animate the heat map to display netflow data. The map looks similar to the previous plot, but shows changes through time.
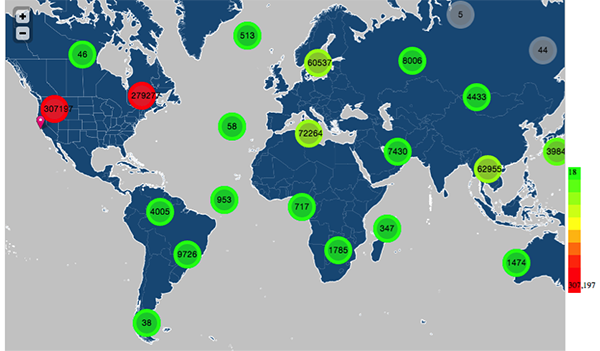
- An interactive cluster map with clusters of networks associated with the provided IP addresses. Cluster maps dynamically reallocate bins of data at each zoom level. The cluster map below shows about 1.6 million IP addresses that were part of a DNS DDOS attack:
In any SOC, a geospatial toolkit can be used to rapidly answer questions such as
- Where is the attacker located?
- How distributed is the attack?
- What possible mitigations can be made knowing the attack's geospatial view?
Do you have more use cases? To what extent is geographical churn present, indicating IP fluxing? Send your comments and ideas to netsa-contact@cert.org.
Written By

More By The Author
More In CERT/CC Vulnerabilities
PUBLISHED IN
Get updates on our latest work.
Sign up to have the latest post sent to your inbox weekly.
Subscribe Get our RSS feedMore In CERT/CC Vulnerabilities
Get updates on our latest work.
Each week, our researchers write about the latest in software engineering, cybersecurity and artificial intelligence. Sign up to get the latest post sent to your inbox the day it's published.
Subscribe Get our RSS feed