Dealing with Noisy Behavioral Analytics in Detection Engineering

Detection engineers and threat hunters understand that targeting adversary behaviors is an essential part of an effective detection strategy (think Pyramid of Pain). Yet, inherent in focusing analytics on adversary behaviors is that malicious behavior will often enough overlap with benign behavior in your environment, especially as adversaries try to blend in and increasingly live off the land. Imagine you’re preparing to deploy a behavioral analytic to complement your detection strategy. Doing so could include custom development, trying out a new Sigma rule, or new behavioral detection content from your security information and event management (SIEM) vendor. Perhaps you’re considering automating a previous hunt, but unfortunately you find that the target behavior is common in your environment.
Is this a bad detection opportunity? Not necessarily. What can you do to make the analytic outputs manageable and not overwhelm the alert queue? It is often said that you must tune the analytic for your environment to reduce the false positive rate. But can you do it without sacrificing analytic coverage? In this post, I discuss a process for tuning and related work you can do to make such analytics more viable in your environment. I also briefly discuss correlation, an alternative and complementary means to manage noisy analytic outputs.
Tuning the Analytic
As you’re developing and testing the analytic, you’re inevitably assessing the following key questions, the answers to which ultimately dictate the need for tuning:
- Does the analytic correctly identify the target behavior and its variations?
- Does the analytic identify other behavior different than the intention?
- How common is the behavior in your environment?
Here, let’s assume the analytic is accurate and fairly robust in order to focus on the last question. Given these assumptions, let’s depart from the colloquial use of the term false positive and instead use benign positive. This term refers to benign true positive events in which the analytic correctly identifies the target behavior, but the behavior reflects benign activity.
If the behavior basically never happens, or happens only occasionally, then the number of outputs will typically be manageable. You might accept those small numbers and proceed to documenting and deploying the analytic. However, in this post, the target behavior is common in your environment, which means you must tune the analytic to prevent overwhelming the alert queue and to maximize the potential signal of its outputs. At this point, the basic objective of tuning is to reduce the number of results produced by the analytic. There are generally two ways to do this:
- Filter out the noise of benign positives (our focus here).
- Adjust the specificity of the analytic.
While not the focus of this post, let’s briefly discuss adjusting the specificity of the analytic. Adjusting specificity means narrowing the view of the analytic, which entails adjusting its telemetry source, logical scope, and/or environmental scope. However, there are coverage tradeoffs associated with doing this. While there is always a balance to be struck due to resource constraints, in general it is better (for detection robustness and durability) to cast a wide net; that is, choose telemetry sources and construct analytics that broadly identify the target behavior across the broadest swath of your environment. Essentially, you are choosing to accept a larger number of possible results in order to avoid false negatives (i.e., completely missing potentially malicious instances of the target behavior). Therefore, it is preferable to first focus tuning efforts on filtering out benign positives over adjusting specificity, if feasible.
Filtering Out Benign Positives
Running the analytic over the last, say, week of production telemetry, you are presented with a table of numerous results. Now what? Figure 1 below shows the cyclical process we’ll walk through using a couple of examples targeting Kerberoasting and Non-Standard Port techniques.
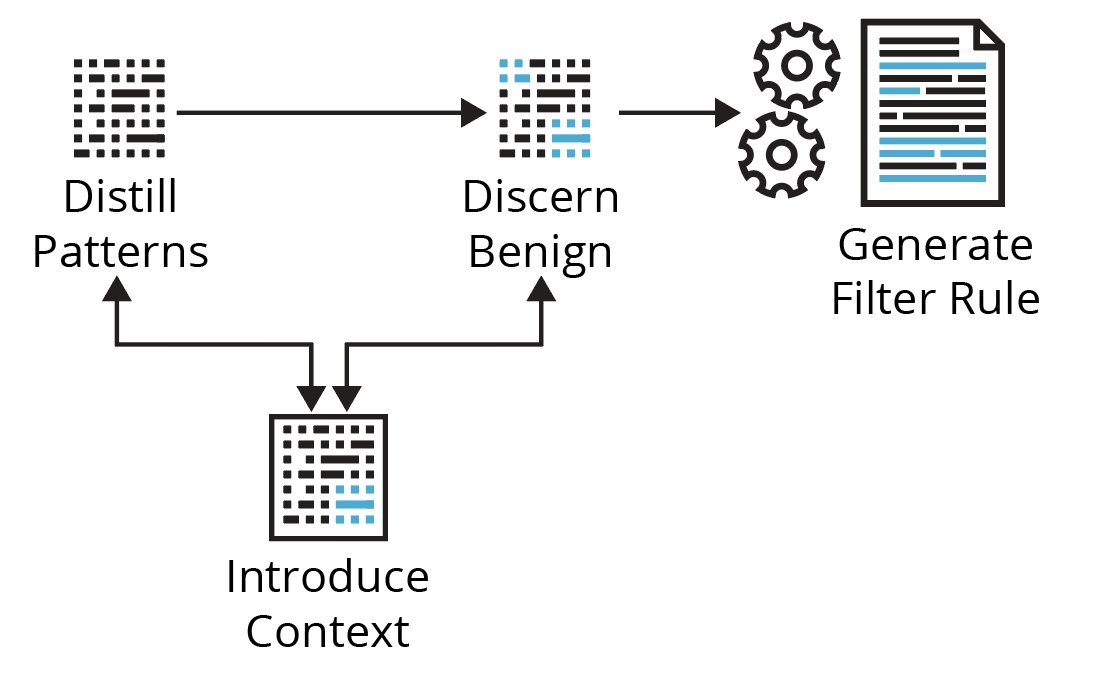
Distill Patterns
Dealing with numerous analytic results doesn’t necessarily mean you have to track down each one individually or have a filter for each result—the sheer number makes that impractical. Hundreds of results can potentially be distilled to a few filters—it depends on the available context. Here, you’re looking to explore the data to get a sense of the top entities involved, the variety of relevant contextual values (context cardinality), how often those change (context velocity), and which relevant fields may be summarized. Start with entities or values associated with the most results; that is, try to address the largest chunks of related events first.
Examples
- Kerberoasting—Say this Sigma rule returns results with many different AccountNames and ClientAddresses (high context cardinality), but most results are associated with relatively few ServiceNames (of certain legacy devices; low context cardinality) and TicketOptions. You expand the search to the last 30 days and find the ServiceNames and TicketOptions are much the same (low context velocity), but other relevant fields have more and/or different values (high context velocity). You’d focus on those ServiceNames and/or TicketOptions, confirm it’s expected/known activity, then address a big chunk of the results with a single filter against those ServiceNames.
- Non-Standard Port—In this example, you find there is high cardinality and high velocity in just about every event/network flow field, except for the service/application label, which indicates that only SSL/TLS is being used on non-standard ports. Again, you expand the search and notice a lot of different source IPs that could be summarized by a single Classless Inter-Domain Routing (CIDR) block, thus abstracting the source IP into a piece of low-cardinality, low-velocity context. You’d focus on this apparent subnet, trying to understand what it is and any associated controls around it, confirm its expected and/or known activity, then filter accordingly.
Fortunately, there are usually patterns in the data that you can focus on. You generally want to target context with low cardinality and low velocity because it impacts the long-term effectiveness of your filters. You don’t want to constantly be updating your filter rules by relying on context that changes too often if you can help it. However, sometimes there are many high-cardinality, high-velocity fields, and nothing quite stands out from basic stacking, counting, or summarizing. What if you can’t narrow the results as is? There are too many results to investigate each one individually. Is this just a bad detection opportunity? Not yet.
Discern Benign
The main concern in this activity is quickly gathering sufficient context to disposition analytic outputs with an acceptable level of confidence. Context is any data or information that meaningfully contributes to understanding and/or interpreting the circumstances/conditions in which an event/alert occurs, to discern behavior as benign, malicious, or suspicious/unknown. Table 1 below describes the most common types of context that you will have or seek to gather.
Table 1: Common Types of Context
| Type | Description | Typical Sources | Example(s) |
| Event | basic properties/parameters of the event that help define it | raw telemetry, log fields | process creation fields, network flow fields, process network connection fields, Kerberos service ticket request fields |
| Environmental | data/information about the monitored environment or assets in the monitored environment | CMDB /ASM/IPAM, ticket system, documentation, the brains of other analysts, admins, engineers, system/network owners | business processes, network architecture, routing, proxies, NAT, policies, approved change requests, services used/exposed, known vulnerabilities, asset ownership, hardware, software, criticality, location, enclave, etc. |
| Entity | data/information about the entities (e.g., identity, source/destination host, process, file) involved in the event | IdP /IAM, EDR, CMDB /ASM/IPAM, 3rd-party APIs | • enriching a public IP address with geolocation, ASN info, passive DNS, open ports/protocols/services, certificate information
• enriching an identity with description, type, role, privileges, department, location, etc. |
| Historical | • how often the event happens
• how often the event happens with certain characteristics or entities, and/or • how often there’s a relationship between select entities involved in the event |
baselines | • profiling the last 90 days of DNS requests per top-level domain (TLD)
• profiling the last 90 days of HTTP on non-standard ports •profiling process lineage |
| Threat | • attack (sub-)technique(s)
• example procedure(s) • likely attack stage • specific and/or type of threat actor/malware/tool known to exhibit the behavior • reputation, scoring, etc. |
threat intelligence platform (TIP), MITRE ATT&CK, threat intelligence APIs, documentation | reputation/detection scores, Sysmon-modular annotations; ADS example |
| Analytic | • how and why this event was raised
• any relevant values produced/derived by the analytic itself • the analytic logic, known/common benign example(s) • recommended follow-on actions • scoring, etc. |
analytic processing,
documentation, runbooks |
"event": { "processing": { "time_since_flow_start": "0:04:08.641718", "duration": 0.97 }, "reason": "SEEN_BUT_RARELY_OCCURRING", "consistency_score": 95 } |
| Correlation | data/information from associated events/alerts (discussed below in Aggregating the Signal ) | SIEM/SOAR, custom correlation layer | risk-based alerting, correlation rules |
| Open-source | data/information generally available via Internet search engines | Internet | vendor documentation states what service names they use, what other people have seen regarding TCP/2323 |
Upon initial review, you have the event context, but you typically end up looking for environmental, entity, and/or historical context to ideally answer (1) which identities and software caused this activity, and (2) is it legitimate? That is, you are looking for information about the provenance, expectations, controls, assets, and history regarding the observed activity. Yet, that context may or may not be available or too slow to acquire. What if you can’t tell from the event context? How else might you tell those events are benign or not? Is this just a bad detection opportunity? Not yet. It depends on your options for gathering additional context and the speed of those options.
Introduce Context
If there aren’t obvious patterns and/or the available context is insufficient, you can work to introduce patterns/context via automated enrichments and baselines. Enrichments may be from internal or external data sources and are usually automated lookups based on some entity in the event (e.g., identity, source/destination host, process, file, etc.). Even if enrichment opportunities are scarce, you can always introduce historical context by building baselines using the data you’re already collecting.
With the multitude of monitoring and detection recommendations using terms such as new, rare, unexpected, unusual, uncommon, abnormal, anomalous, never been seen before, unexpected patterns and metadata, does not normally occur, etc., you’ll need to be building and maintaining baselines anyway. No one else can do these for you—baselines will always be specific to your environment, which is both a challenge and an advantage for defenders.
Kerberoasting
Unless you have programmatically accessible and up-to-date internal data sources to enrich the AccountName (identity), ServiceName/ServiceID (identity), and/or ClientAddress (source host; typically RFC1918), there’s not much enrichment to do except, perhaps, to translate TicketOptions, TicketEncryptionType, and FailureCode to friendly names/values. However, you can baseline these events. For example, you might track the following over a rolling 90-day period:
- percent days seen per ServiceName per AccountName → identify new/rare/common user-service relationships
- mean and mode of unique ServiceNames per AccountName per time period → identify unusual number of services for which a user makes service ticket requests
You could expand the search (only to develop a baseline metric) to all relevant TicketEncryption Types and additionally track
- percent days seen per TicketEncryptionType per ServiceName → identify new/rare/common service-encryption type relationships
- percent days seen per TicketOptions per AccountName → identify new/rare/common user-ticket options relationships
- percent days seen per TicketOptions per ServiceName → identify new/rare/common service-ticket options relationships
Non-Standard Port
Enrichment of the destination IP addresses (all public) is a good place to start, because there are many free and commercial data sources (already codified and programmatically accessible via APIs) regarding Internet-accessible assets. You enrich analytic results with geolocation, ASN, passive DNS, hosted ports, protocols, and services, certificate information, major-cloud provider information, etc. You now find that all of the connections are going to a few different netblocks owned by a single ASN, and they all correspond to a single cloud provider’s public IP ranges for a compute service in two different regions. Moreover, passive DNS indicates a number of development-related subdomains all on a familiar parent domain. Certificate information is consistent over time (which indicates something about testing) and has familiar organizational identifiers.
Newness is easily derived—the relationship is either historically there or it isn’t. However, you’ll need to determine and set a threshold in order to say what is considered rare and what is considered common. Having some codified and programmatically accessible internal data sources available would not only add potentially valuable context but expand the options for baseline relationships and metrics. The art and science of baselining involves determining thresholds and which baseline relationships/metrics will provide you with meaningful signal.
Overall, with some extra engineering and analysis work, you’re in a much better position to distill patterns, discern which events are (probably) benign, and to make some filtering decisions. Moreover, whether you build automated enrichments and/or baseline checks into the analytic pipeline, or build runbooks to gather this context at the point of triage, this work feeds directly into supporting detection documentation and enhances the overall speed and quality of triage.
Generate Filter Rule
You want to smartly apply filters without having to manage too many rules, but you want to do so without creating rules that are too broad (which risks filtering out malicious events, too). With filter/allow list rules, rather than be overly broad, it is better to lean toward a more precise description of the benign activity and possibly have to create/manage a few more rules.
Kerberoasting
The baseline information helps you understand that those few ServiceNames do in fact have a common and consistent history of occurring with the other relevant entities/properties of the events shown in the results. You determine those are OK to filter out, and you do so with a single, simple filter against those ServiceNames.
Non-Standard Port
Enrichments have provided valuable context to help discern benign activity and, importantly, also enabled the abstraction of the destination IP, a high-cardinality, high-velocity field, from many different, changing values to a few broader, more static values described by ASN, cloud, and certificate information. Given this context, you determine those connections are probably benign and move to filter them out. See Table 2 below for example filter rules, where app=443 indicates SSL/TLS and major_csp=true indicates the destination IP of the event is in one of the published public IP ranges of a major cloud service provider:
| Type | Filter Rule | Reason |
|---|---|---|
| Too broad | sip=10.2.16.0/22; app=443; asn=16509; major_csp=true | You don’t want to allow all non-standard port encrypted connections from the subnet to all cloud provider public IP ranges in the entire ASN. |
| Still too broad | sip=10.2.16.0/22; app=443; asn=16509; major_csp=true; cloud_provider=aws; cloud_service=EC2; cloud_region=us-west-1,us-west-2 | You don’t know the nature of the internal subnet. You don’t want to allow all non-standard port encrypted traffic to be able to hit just any EC2 IPs across two entire regions. Cloud IP usage changes as different customers spin up/down resources. |
| Best option | sip=10.2.16.0/22; app=443; asn=16509; major_csp=true; cloud_provider=aws; cloud_service=EC2; cloud_region=us-west-1,us-west-2; cert_subject_dn=‘L=Earth|O=Your Org|OU=DevTest|CN=dev.your.org’ | It is specific to the observed testing activity for your org, but broad enough that it shouldn’t change much. You will still know about any other non-standard port traffic that doesn’t match all of these characteristics. |
An important corollary here is that the filtering mechanism/allow list needs to be applied in the right place and be flexible enough to handle the context that sufficiently describes the benign activity. A simple filter on ServiceNames relies only on data in the raw events and can be filtered out simply using an extra condition in the analytic itself. On the other hand, the Non-Standard Port filter rule relies on data from the raw events as well as enrichments, in which case those enrichments need to have been performed and available in the data before the filtering mechanism is applied. It’s not always sufficient to filter out benign positives using only fields available in the raw events. There are various ways you could account for these filtering scenarios. The capabilities of your detection and response pipeline, and the way it is engineered, will impact your ability to effectively tune at scale.
Aggregate the Signal
So far, I’ve talked about a process for tuning a single analytic. Now, let’s briefly discuss a correlation layer, which operates across all analytic outputs. Sometimes an identified behavior just isn’t a strong enough signal in isolation; it may only become a strong signal in relation to other behaviors, identified by other analytics. Correlating the outputs from multiple analytics can tip the signal enough to meaningfully populate the alert queue as well as provide valuable additional context.
Correlation is often entity-based, such as aggregating analytic outputs based on a shared entity like an identity, host, or process. These correlated alerts are typically prioritized via scoring, where you assign a risk score to each analytic output. In turn, correlated alerts will have an aggregate score that is usually the sum, or some normalized value, of the scores of the associated analytic outputs. You would sort correlated alerts by the aggregate score, where higher scores indicate entities with the most, or most severe, analytic findings.
The outputs from your analytic don’t necessarily have to go directly to the main alert queue. Not each and every analytic output needs be triaged. Perhaps the efficacy of the analytic primarily exists in providing additional signal/context in relation to other analytic outputs. As correlated alerts bubble up to analysts only when there is strong enough signal between multiple associated analytic outputs, correlation serves as an alternative and complementary means to make the number of outputs from a noisy analytic less of a nuisance and overall outputs more manageable.
Improving Availability and Speed of Relevant Context
It all turns on context and the need to quickly gather sufficient context. Speed matters. Prior to operational deployment, the more quickly and confidently you can disposition analytic outputs, the more outputs you can deal with, the faster and better the tuning, the higher the potential signal of future analytic outputs, and the sooner you’ll have a viable analytic in place working for you. After deployment, the more quickly and confidently you can disposition analytic outputs, the faster and better the triage and the sooner appropriate responses can be pursued. In other words, the speed of gathering sufficient context directly impacts your mean time to detect and mean time to respond. Inversely, barriers to quickly gathering sufficient context are barriers to tuning/triage; are barriers to viable, effective, and scalable deployment of proactive/behavioral security analytics; and are barriers to early warning and risk reduction. Consequently, anything you can do to improve the availability and/or speed of gathering relevant context is a worthwhile effort for your detection program. Those things include:
- building and maintaining relevant baselines
- building and maintaining a correlation layer
- investing in automation by getting more contextual information—especially internal entities and environmental context—that is codified, made programmatically accessible, and integrated
- building relationships and tightening up security reporting/feedback loops with relevant stakeholders—a holistic people, process, and technology effort; consider something akin to these automated security bot use cases
- building relationships with security engineering and admins so they are more willing to assist in tweaking the signal
- supporting data engineering, infrastructure, and processing for automated enrichments, baseline checks, and maintenance
- tweaking configurations for detection, e.g., deception engineering, this example with ticket times, etc.
- tweaking business processes for detection, e.g., hooks into certain approved change requests, admins always do this little extra special thing to let you know it’s really them, etc.
Summary
Analytics targeting adversary behaviors will often enough require tuning for your environment due to the identification of both benign and malicious instances of that behavior. Just because a behavior may be common in your environment doesn’t necessarily mean it’s a bad detection opportunity or not worth the analytic effort. One of the primary ways of dealing with such analytic outputs, without sacrificing coverage, is by using context (often more than is contained in the raw events) and flexible filtering to tune out benign positives. I advocate for detection engineers to perform most of this work, essentially conducting a data study and some pre-operational triage of their own analytic results. This work generally entails a cycle of evaluating analytic results to distill patterns, discerning benign behavior, introducing context as necessary, and finally filtering out benign events. We used a couple basic examples to show how that cycle might play out.
If the immediate context is insufficient to distill patterns and/or discern benign behavior, detection engineers can almost always supplement it with automated enrichments and/or baselines. Automated enrichments are more common for external, Internet-accessible assets and may be harder to come by for internal entities, but baselines can typically be built using the data you’re already collecting. Plus, historical/entity-based context is some of the most useful context to have.
In seeking to produce viable, quality analytics, detection engineers should exhaust, or at least try, these options before dismissing an analytic effort or sacrificing its coverage. It is extra work, but doing this work not only improves pre-operational tuning but pays dividends on post-operational deployment as analysts triage alerts/leads using the extra context and well-documented research. Analysts are then in a better position to identify and escalate findings but also to provide tuning feedback. Besides, tuning is a continuous process and a two-pronged effort between detection engineers and analysts, if only because threats and environments are not static.
The other primary way of dealing with such analytic outputs, again without sacrificing coverage, is by incorporating a correlation layer into your detection pipeline. Correlation is also more work because it adds another layer of processing, and you have to score analytic outputs. Scoring can be tricky because there are many things to consider, such as how risky each analytic output is in the grand scheme of things, if/how you should weight and/or boost scores to account for various circumstances (e.g., asset criticality, time), how you should normalize scores, whether you should calculate scores across multiple entities and which one takes precedence, etc. Nevertheless, the benefits of correlation make it a worthwhile effort and a great option to help prioritize across all analytic outputs. Also, it effectively diminishes the problem of noisier analytics since not every analytic output is meant to be triaged.
If you need help doing any of these things, or would like to discuss your detection engineering journey, please contact us.
Additional Resources
Revisiting the Idea of the "False Positive"
SIEM Content, False Positives and Engineering (Or Not) Security
Context Matters: Harnessing Creativity to Triage Security Alerts
Create Context-Aware Analytics
Baseline Hunting with the PEAK Framework
Model-Assisted Threat Hunting (M-ATH) with the PEAK Framework
Detection Engineering Maturity Matrix
Scaling Detection and Response Operations at Coinbase Pt. 1, Pt. 2, Pt. 3
Written By

More By The Author
More In Situational Awareness
PUBLISHED IN
Get updates on our latest work.
Sign up to have the latest post sent to your inbox weekly.
Subscribe Get our RSS feedMore In Situational Awareness
Get updates on our latest work.
Each week, our researchers write about the latest in software engineering, cybersecurity and artificial intelligence. Sign up to get the latest post sent to your inbox the day it's published.
Subscribe Get our RSS feed