Deep Learning and Satellite Imagery: DIUx Xview Challenge

PUBLISHED IN
Artificial Intelligence EngineeringIn 2017 and 2018, the United States witnessed a milestone year of climate and weather-related disasters from droughts and wildfires to cyclones and hurricanes. Increasingly, satellites are playing an important role in helping emergency responders assess the damage of a weather event and find victims in its aftermath. Most recently satellites have tracked the devastation wrought by the California wildfires from space. The United States military, which is often the first on the scene of a natural disaster, is increasingly interested in the use of deep learning to automate the identification of victims and structures in satellite imagery to assist with humanitarian assistance disaster relief (HADR) efforts.
To that end, the Defense Innovation Unit (DIU) recently launched the xView 2018 Detection Challenge, which was conducted by the Pentagon in partnership with the National Geospatial-Intelligence Agency, to seek out innovative uses of computer vision techniques to more accurately detect images in satellite imagery. As described in this blog post, I worked with a team of researchers in the xView challenge that earned us a fifth-place finish. This activity is our latest effort in using machine learning and artificial intelligence to assist the federal government with HADR efforts.
Deep Learning and Satellite Imagery
Scanning satellite images to detect images and buildings and other objects from space has become a priority for the government, but it is often a slow, painstaking process undertaken by analysts that also introduces the potential for human error. Even with high-resolutions datasets and classification, challenges can crop up as analysts encounter storage, bandwidth, and memory issues.
The state of the art for computer vision via satellite is computational neural networks, which have been effective in reasoning about satellite images. My first foray into this field was with IARPA's Functional Map of the World (FMOW) Challenge. In conjunction with John Hopkins University's Applied Physics Laboratory, IARPA created a dataset of more than 1 million multispectral satellite images of sites on the earth's surface from more than 200 countries. Each image in the dataset contained at least one example of a facility or land object that fell into one of 63 categories (62 classes and 1 for false detection) such as "military facility," "barn," or "construction site."
Our aim was to see if we could get a functional prototype up and running with reasonable accuracy. As outlined in a paper on our work, we applied several deep learning approaches using many flavors of convolutional neural networks:
We had three main approaches for FMOW:
1) Using a deep convolutional neural network (CNN) (with an architecture such as DenseNet or RetinaNet) pre-trained on various datasets as a general-purpose feature extractor in tandem with a shallow CNN that learned satellite imagery specific features. These would be combined using fully-connected layers and finally output a length 63 softmax vector.
2) Training an ensemble of binary "one-vs-all" classifiers
3) By "cheating" and using validation data that contained false detections, we could train a support vector machine (SVM) that learned to differentiate between false detections and "real" data, then use method 1 only on the real data.
In the end, our first method was the most successful and was the model architecture that we iterated over multiple times to tune for the challenge.
Building off Functional Map of the World
Building off Functional Map of the World (FMoW), the xView challenge applies computer vision to the growing amount of available imagery from space so that we can understand the visual world in new ways and address a range of important applications. In searching for algorithms to potentially automate computer vision of satellite imagery, the xView Challenge provides competitors with one of the largest publicly available datasets of satellite imagery and asks them to
- reduce minimum resolution for detection
- improve learning efficiency
- enable discovery of more object classes
- improve detection of fine-grained classes
In addition to myself, the xView Challenge Team included 2nd Lt. Alex Fulton, a graduate student at the U.S. Air Force Institute of Technology and Carnegie Mellon University's Information Networking Institute; and Kaylene Stocking, an undergraduate student at the University of Pittsburgh.
The xView Challenge proved an ideal competition for our work in the SEI's Emerging Technology Center, which focuses on identifying, demonstrating, extending, and applying new technologies to meet critical government needs. We promote government awareness and knowledge of these emerging technologies and their application, in addition to shaping and leveraging academic and industrial research. The xView Challenge allowed us to explore several approaches to computer vision that we had wanted to validate.
The remainder of the post, which is excerpted from the technical report that we submitted as part of our participation in the challenge, highlights excerpts of our work in the xView Challenge.
Data Cleaning
The xView dataset is large--1 million object images with 60 classes and a 0.3 meter resolution--and labeled using crowd-sourced annotations for bounding boxes and classes. The paper that DIUx included to accompany the release of the dataset, xView: Objects in Context in Overhead Imagery, discusses that the collection techniques by nature accepted a level of noisiness in the data.
In our analysis, the amount of mislabeled data and noisy bounding boxes were significant enough to affect overall model training. We explored multiple techniques for cleaning the data and ultimately decided that any technique that we implemented would be infeasible given the schedule constraints of the challenge. We therefore decided to accept any losses in accuracy that would be a result of the noisy data.
Processing the Data via Chipping
Due to image size and object density, we encountered challenges when trying to pass the entire image into a neural network. As outlined in the paper that we submitted with our dataset, the xView baseline model attempted to split each image into smaller-sized tiles using chipping strategies, using multiple chip sizes at 300 px2, 400 px2, and 500 px2 in one model (multi-res). We experimented with the multi-res approach, but it destabilized our learning process, so we stuck with a chip size of 300 px2.
We also experimented with a simple overlapping chipping technique that involved overlapping neighboring chips by an amount proportional to the chip size (50 percent), which provided a 15 percent increase in accuracy of detection and also proved more feasible for use with large satellite images.
We based our reasoning on the fact that the baseline performed significantly faster than the time limit imposed by the competition and our observation that object detection performance declined significantly at the near the edges of each chip
We improved on the model even further by letting objects near the middle of the boundary between two overlapping chips be detected by both chips. Instead of double counting the overlapping detections, we first used non-max suppression to ensure that only the most confident prediction would be outputted.
Non-Max Suppression
We encountered instances in which our models output multiple overlapping boxes over the same object, which led to a lower total mean average precision (mAP). To address this issue, we used non-max suppression to only keep the largest box, which sufficiently fit the object.
Data Augmentation
Increasing the amount of data available via augmentation is a common practice in the computer vision community. Our team experimented with various random combinations of augmentations per chip to multiple training epochs to evaluate how our model performed with variants in the data including the following:
- horizontal flips
- vertical flips
- RGP to grayspace conversions
- brightness fluctuations
- contrast adjustments
- hue distortions
- saturation adjustments
- color distortions
- bounding box jitters
- crops to a fixed aspect ratio
- channel mean subtractions
- rotations
Of these augmentations, horizontal flips, vertical flips, and crops to a fixed aspect ratio resulted in the highest increase in model accuracy and mAP. We discarded the other augmentations, which resulted in minimum or negative gains in performance.
Data Imbalances
As shown in the table below, the dataset provided by xView was highly imbalanced, resulting in a skewed learning process that prevented models from learning accurate representations of uncommon classes.
Table 1: Class counts...
CLASS COUNT
Building 287,074
Bus 6,316
Railway Vehicle 17
A random sampling approach would severely under-represent the railway vehicle class, so we used an inversely proportional sampling approach, in which the underrepresented chips were oversampled by their inverse proportion in the dataset. Oversampling is a common approach and provided us with good learning stability in under-represented classes.
Developing Custom Models
To provide a flexible, define-by-config approach--instead of writing code to create a model, edit a config file, which just contains parameters, and that file will automatically build a model and train it--to creating scalable models, DIUx provided a baseline that was created using the TensorFlow object detection API (TF-ODAPI).
We also developed custom models using TensorFlow and Keras to accommodate custom loss functions, different architectures, and various sorts of pre-training, we had to look outside of the TF-OD API.
Overall, the TF-OD API allowed us to create functional models and modify various parameters and model architectures. However, to build functionality that is not covered by the average use case, we found it necessary to dig deeper into custom code using TensorFlow and Keras.
Two of the most common architectures for simultaneous localization and classification are the Single Shot MultiBox Detector (SSD) and You only look once (YOLO). The TF-ODAPI provides functionality to alter the parameters of both of these architectures and it works relatively well on the dataset.
We also explored beyond the TF-ODAPI and, using TensorFlow and Keras, experimented with architectures such as Retinanet, Faster R-CNN, YOLOv3 and other custom models. Ultimately, a variant of SSD provided us with the best results. YOLO worked well in terms of mAP when we parametrized it with a large number of anchor boxes.
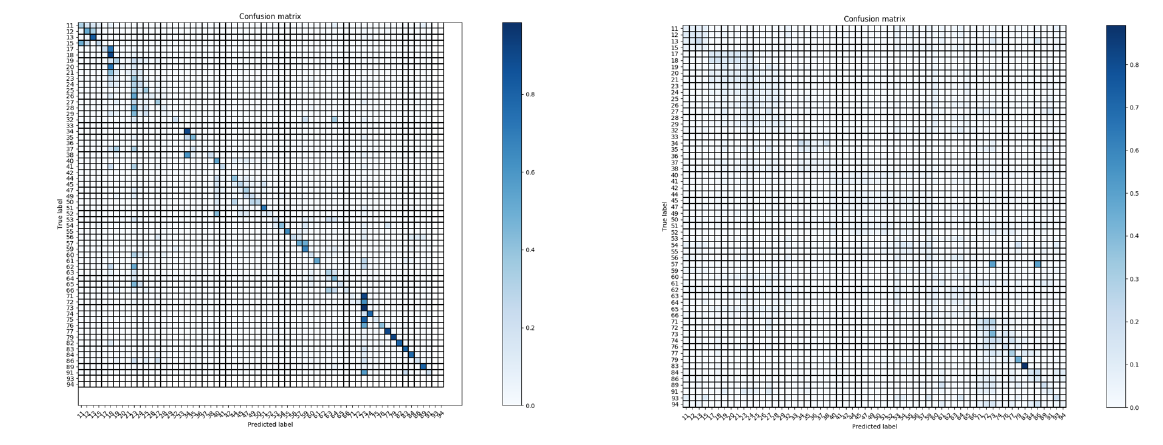
Figure 4: Confusion matrix for SSD. Figure 5: Confusion matrix for YOLO.
In figures 4 and 5 above, it is important to note the high levels of intra-category confusion in both SSD and YOLO. In particular, these models can classify things such as car vs. building really well, but within the categories performs less than ideally. This limitation is a function of the challenge itself, and it is clear that it was not effectively tackled by our approaches.
Challenges in Pre Training
Pre-training is an important and necessary step in using deep learning to achieve more classification accuracy in satellite imagery. Our team identified a parallel dataset called "DOTA: A Large-scale Dataset for Object Detection in Aerial Images" that provided 15 classes to localize and classify over with boxes that were not axis aligned, unlike xView. Our aim was to learn general features about classes from DOTA, and then continue training on xView with a larger output vector to accommodate its 60 classes and hopefully observe a large gain in accuracy.
Pre-training on DOTA, however, was not a success. While we were able to get mAPs as high as 0.75 on that dataset, we often performed worse than baseline once we transferred it to xView. However, we did observe a bump in our F1 score. Since that was not the metric to beat, we did not pursue this line of exploration further. Pre-training on a larger dataset like ImageNet did not provide us gains in mAP either.
Looking Ahead
The use of deep learning in satellite imagery not only helps identify where crises are occurring, but also helps rescuers save human lives. Our goal with xView was to demonstrate that it is possible to build a very big prototype in a relatively small amount of time to solve mission goals.
The success of our approach was validated by the xView Challenge scoring system which automatically scored submissions based on accuracy of classification.
The DIU stated in a recent news release that it had already begun testing winning algorithms from the xView Challenge in the wake of Hurricane Florence, assisting emergency personnel in quickly identifying flooded areas and impassable roads.
Additional Resources
Learn more about the xView Challenge.
Written By

More In Artificial Intelligence Engineering
PUBLISHED IN
Artificial Intelligence EngineeringGet updates on our latest work.
Sign up to have the latest post sent to your inbox weekly.
Subscribe Get our RSS feedMore In Artificial Intelligence Engineering
Get updates on our latest work.
Each week, our researchers write about the latest in software engineering, cybersecurity and artificial intelligence. Sign up to get the latest post sent to your inbox the day it's published.
Subscribe Get our RSS feed