Insider Threat Case Trends for Employee Type and Employment Status
We recently met with leaders from the U.S. financial services sector, and they asked a number of questions about recent trends in insider threat activities. We are often asked these types of questions, and we can answer many of them right away. Others require more extensive data mining in our case database. In this entry, we address the following question:
Between current employees, former employees, and contractors,
is one group most likely to commit these crimes?
The answer to this question has some important implications, and not just for these particular meeting attendees. If, across all types of incidents and all sectors, the vast majority of incidents are caused by current, full-time employees, organizations may focus on that group to address the vulnerability. If, on the other hand, there are a large number of part-time contractors or former employees, there may be different controls that an organization should consider using.
Before we discuss the data and its implications, there are some caveats. Our sample of incidents only involves individuals who were caught and prosecuted for their crimes. Also, we currently only have data about incidents that were reported to law enforcement, so these were examples that reached a certain threshold of damages and satisfactory evidence to furnish in a court of law. Finally, it is not entirely accurate to infer from our sample that the results and figures apply to all sectors and all organizations. We are providing these statistics as "food for thought" and to add to the discussion about an important threat that most organizations face.
To develop the answer to the question above, we used 401 cases of all crime types (i.e., IT sabotage, fraud, and theft of intellectual property) spanning all critical infrastructure sectors. Within that sample, there were 85 cases of all types of crime involving only the financial services sector.
The figure below shows the number of cases per year by employee type, constrained to either employee (current or former) or contractor. The graph on the left shows all cases, while the one on the right shows only financial services sector cases.
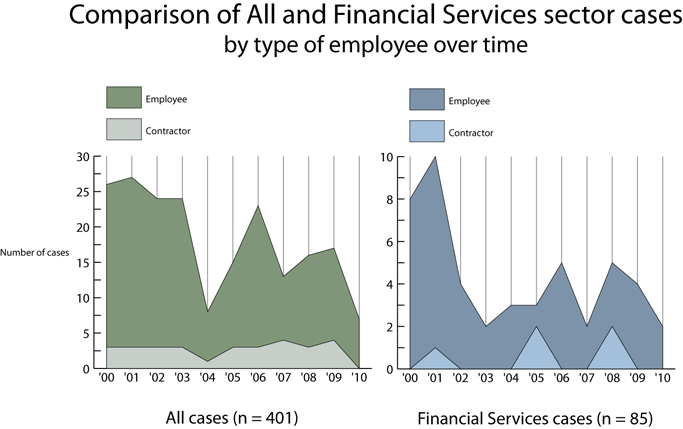
In the ten years shown in the graphs, the percentage of incidents involving a contractor hovers around 15%. Whether the number of total incidents for a particular year is higher or lower, the percentages stay roughly the same. What is most interesting about these two graphs is that this ratio has stayed the same over the course of ten years of a fairly tumultuous economic environment. This result may indicate that it isn't likely for contractor crimes to raise or lower significantly. But with almost 1 in 7 of our insider threat crimes being committed by contractors, are organizations adequately considering the risk posed by this group?
The second figure below shows the percentage of cases perpetrated by current and former employees in all cases and in only the financial services sector. The chart also shows the ratio of employment type (full-time, part-time, or contractor) depicted within each bar. In some cases, we were not certain whether the incident was committed by a current or former employee, so we indicated those incidents as unknown.
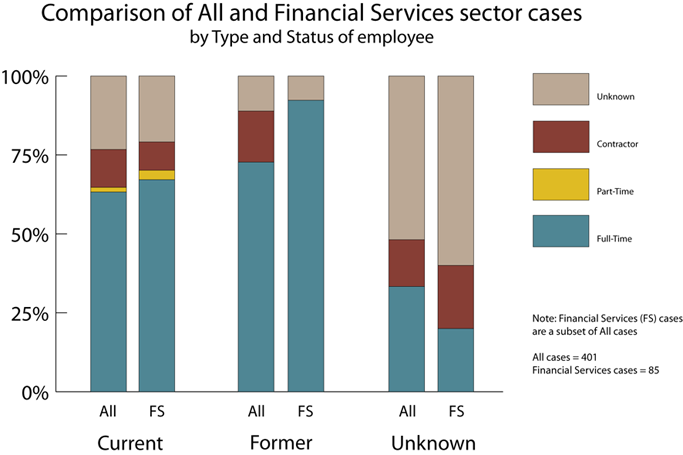
At first glance, the financial services sector cases seem to mirror all cases. Full-time employees have the greatest percentage across all sectors for both current and former employees. Part-time employees form a small percentage of our cases across all employee status and types. The contractor results, on the other hand, reveal an interesting trend. For current employees, the percentage is about the same for financial services as all sectors. For former employees, however, 16% of all cases were contractors (indicated in burgundy in the center-left bar), and none of those were in the financial services sector.
These results may be meaningful or may be an artifact of the small number of cases (only 16) of former employees in the financial services sector. Regardless, these graphs provide some interesting data points for you to examine within the context of your own organization. Do you use the same prevention and detection controls for all employees, or are you only worried about the majority--the current, full-time employees you see on a daily basis? Use the feedback link to send us your thoughts.
PUBLISHED IN
Get updates on our latest work.
Sign up to have the latest post sent to your inbox weekly.
Subscribe Get our RSS feedMore In Insider Threat
Get updates on our latest work.
Each week, our researchers write about the latest in software engineering, cybersecurity and artificial intelligence. Sign up to get the latest post sent to your inbox the day it's published.
Subscribe Get our RSS feed