Domain Blocklist Ecosystem - A Case Study

PUBLISHED IN
Security VulnerabilitiesHi all, this is Jonathan Spring with my colleagues Leigh Metcalf and Rhiannon Weaver. We've been studying the dynamics of the Internet blocklist ecosystem for a few years now and the 2015 Verizon Data Breach Investigations Report has corroborated our general results. We get a lot of questions about which list is which and if we can recommend a list. We won't reveal which is which generally, but in this blog post we'll make a small exception (with permission of course) in a case study to update the results.
These case study results do not change our overall recommendation that the idea of recommending any single list is fundamentally flawed. Our overall recommendation is corroborated in a research paper by Kuhrer, Rossow, and Holz, which concludes that even the union of all lists is insufficient.
At best, each list has specific detection strategies and almost always targets a unique niche. The quality of a list is how well it fits your business purpose. And since every business is at risk from multiple Internet threats, it's not a question of "which list."
We recommend most lists in smart conjunction--as a starting point--and then using additional defenses since blocklists alone are never enough. (To be clear, we do not recommend or endorse any products or services.)
Our hypothesis is that list non-overlap derives from two obvious sources: sensor vantage and detection strategy. A detection strategy is what the list administrator is looking for, such as outbound zeus command and control domains, inbound SSH attacks, or specific features of abusive email.
For a detection strategy to yield different malicious indicators, the adversaries must intentionally use a different infrastructure for different purposes. We have evidence that the aptly-named exploit-as-a-service infrastructure causes this differentiation.
So far, our blocklist work hasn't directly corroborated this result or measured its extent because we haven't had a case study in which we could hold the sensor vantage constant while the detection strategy varied. Most lists specialize on one sort of malicious activity.
Although it's unlikely, it's possible that all the variation in list content is due to changing vantage since all the lists have different physical and logical sensor locations. However, we'd like some direct evidence that the variation in list content is not due to sensor location (i.e., vantage).
Malcovery's ThreatHQ data can serves as a case study for this purpose. Its indicator extraction process reports if the network touch point is a mail sender, initial infection vector, or malware-runtime derived. Indicators derived from malware runtime data is further broken down into roles for command and control (C2), payload download, or unlabeled.
The total number of indicators is not overwhelming, but the process varies the detection strategy while maintaining the same vantage. This variation permits a test of our hypothesis that different detection strategies explain the differences in different blocklists (because adversaries use different infrastructures for different purposes), and the differences are not just an artifact of different sensor vantage (i.e., location).
We intersected the five Malcovery sub-lists to get a baseline of the expected intersection of indicators from the same vantage with different detection strategies. Since the vantage is the same for all these lists, this test provides an expectation for how much the different detection strategies can overlap.
Then we ran our usual blocklist intersection process with our lists from the 2014 report against each of the five Malcovery sub-lists separately. With this information, we can test whether the Malcovery sub-list aligns with the other blocklists we have.
We know only roughly what the detection strategies of all the other blocklists are. However, we do know that they are different. If detection strategy is the primary driver of the differences between lists, we would expect to see the Malcovery sub-lists intersect little with each other and to see markedly different sets of other blocklists align with each of the five sub-lists.
If vantage is the primary driver of differences between lists, we would expect to see the Malcovery sub-lists intersect and the same pattern of other blocklists align with all five sub-lists (whatever blocklists happen to have a similar vantage).
We also need a big enough sample size and intersection that we can say something meaningful. Our sample runs from January 1, 2014 to February 15, 2015. This sample will have all the problems of overestimating the intersection that we addressed in the last report, which we can ignore for now.
We divide our blocklists into two types: DNSBLs and other lists. There are two indicator formats: DNS names and IP addresses. We have plenty of each on the lists during our sample window.
• DNSBL IPs: 63,293,355
• List IPs: 24,351,775
• DNSBL Domains: 42,478,646
• List Domains: 26,167,242
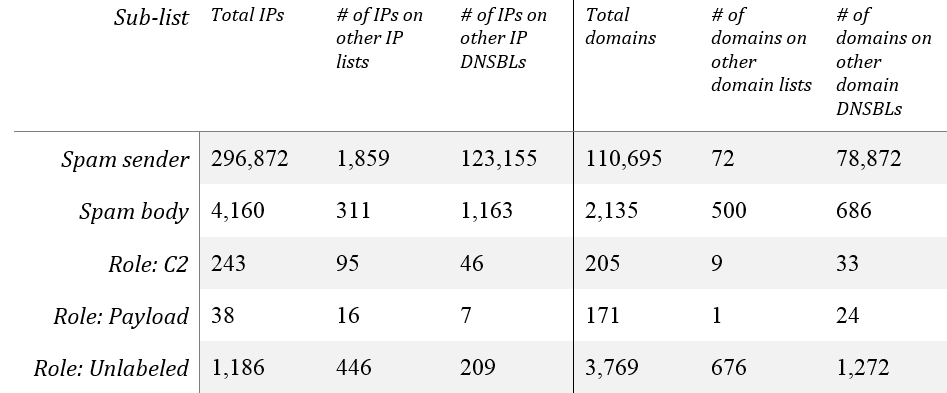
The various Malcovery sub-lists have the parameters and intersections with the sets displayed in Table 1, demonstrating that they're enough to work with meaningfully. As expected, all the Malcovery lists have many indicators not seen on the other lists (out of 26 domain-based lists and 53 IP-address-based lists). The "Spam Sender" sub-list is derived from indicators of hosts sending spam, whereas the "Spam body" sub-list is derived from network indicators found in the email message body of spam. Spam body often provides a full URL, but for the purposes of intersecting, we use only the domain name. The three "Role" sub-lists are derived from dynamic analysis of malicious binaries contained in the spam and classified by their role (if possible).
Table 1: Malcovery sub-list intersections with all other indicator sources.
The intersection of the five sub-lists with each other are displayed in Table 2 for IPs and Table 3 for domains. Although there are some intersections, most of these are plausibly explained by data curation issues rather than reflections of the real world.
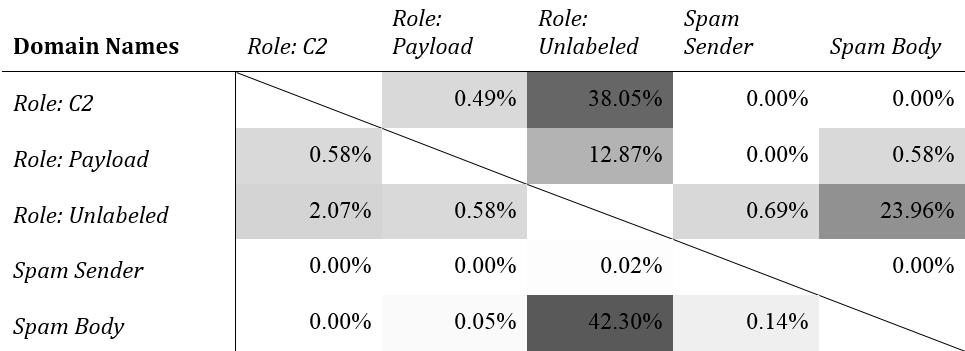
If we reduce the three runtime sources (Role:*) to one kind, the three data sources/detection strategies (spam sender, spam body, and malware runtime) produce nearly disjoint sets of indicators, with one interesting exception: the domains found in spam message bodies and unlabeled dynamic analysis. (See Table 3.)
Table 2: Malcovery IP-address-based sub-list intersections with each other, by percentage of the list in the left column
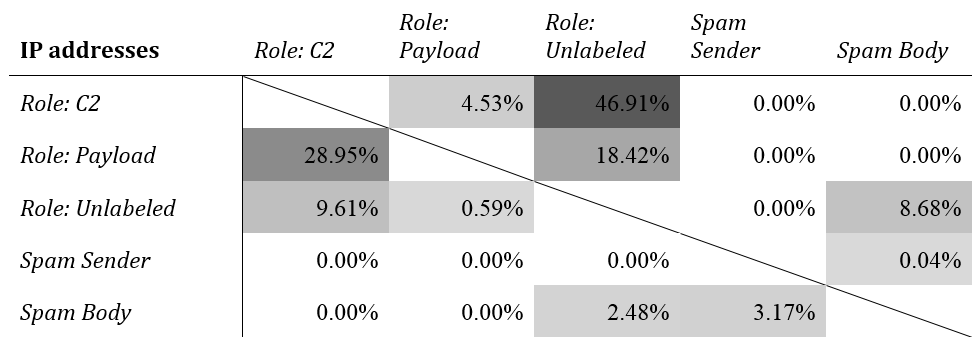
Here's an example that illustrates how to read Table 2. The C2 sub-list has 243 IP addresses, and the Payload sub-list has 38 (from Table 1). Eleven of these are shared, which is 4.53% of the C2 sub-list and 28.95% of the Payload sub-list. The largest intersections are among the three sub-lists derived from dynamic analysis.
The labeling mechanism evolved during the period of observation so items that were once unlabeled later came to be labeled as C2 or something else. The high intersection between C2 and Unlabeled reflects the fact that C2 IPs tend to be stable and have low turnover, since before and after the change in labeling the IPs were still observed. However, the same detection strategy--dynamic analysis of captured malicious binaries--actually underlies both sub-lists, which is why they overlap so much.
Table 3: Malcovery domain-based sub-list intersections with each other, by percentage of the list in the left column
As we demonstrated in our last report, indicator churn, reassignment, and reuse can inflate intersection results. We found a possible difference of up to 12.8 percentage points for IP addresses and 1.2 percentage points for domains. We can use these values to inform our ideas of what intersections are meaningful.
We have a robust method that accounts for various sources of uncertainty in saying what size intersection is meaningful, which we're writing up for a more formal venue than a blog post. For now, let's just say that a small overlap is more likely the result of random indicator churn than an actual relationship. The only intersection of these sub-lists that looks genuine is the domain-based list intersection between spam body domains and unlabeled malware runtime domains.
Domains in the spam body come from URLs in the email. Why does some malware call back out to these domains in a sandbox? These are not the domains used to drop further payloads or for command and control. Malcovery has already filtered out benign domains that might inflate this by chance.
If the spam body URL drove the initial infection, perhaps these sandbox-derived domains are for reporting success. Even if it's something small like that, it's interesting that those domains are reused, but not the IP addresses. This phenomenon seems like it needs some further research.
In general, these results support the hypothesis that a primary driver of list non-overlap is due to detection strategy. Overlap could be further driven by varying vantage; however, a different detection strategy is enough to drive the difference. This result is what we should expect if crimeware is a cheap service that is available on demand from multiple sources, as described by Sood and Enbody.
If you have thoughts on how we should continue to investigate the blocklist ecosystem, please let us know.
Written By

More By The Authors
More In Security Vulnerabilities
PUBLISHED IN
Security VulnerabilitiesGet updates on our latest work.
Sign up to have the latest post sent to your inbox weekly.
Subscribe Get our RSS feedMore In Security Vulnerabilities
Get updates on our latest work.
Each week, our researchers write about the latest in software engineering, cybersecurity and artificial intelligence. Sign up to get the latest post sent to your inbox the day it's published.
Subscribe Get our RSS feed