The Growth Rate of IP Addresses That Are Advertised as Usable on the Internet
Hi, this is Leigh Metcalf of the Network Situational Awareness Team. Recently, I have been considering the amount of IPv4 space that is announced on the Internet. All blocks have been allocated, but how many are actually being used? To investigate this, I examined the routing tables to determine which networks were announced on the internet as usable from January 1, 2009 through December 31, 2012.
I used the data available from Routeviews (http://routeviews.org) and RIPE (https://www.ripe.net/). These data were collected from 22 sources sharing the routing tables of 621 routers located throughout the world. The percentage of new IP address space announced is computed by taking the total announcements for the day, removing any reserved IP space that is announced, and then dividing that total by the total number of IP space available. The number of available IPs is calculated using the entire IPv4 space minus the reserved IP space.
I will be refining the results throughout this post, but Figure 1 illustrates the initial results.
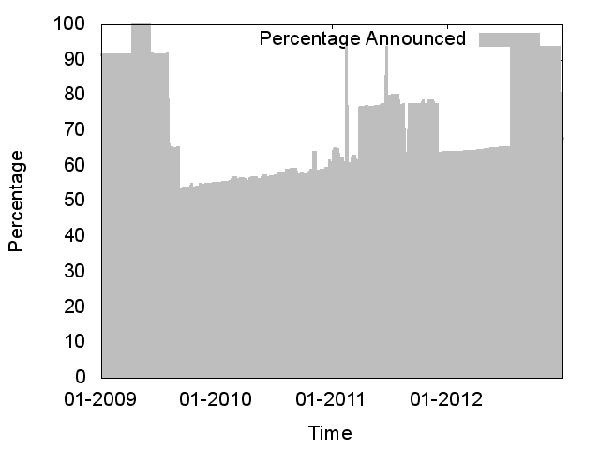
Figure 1 was a bit out of sorts, so I examined the data closely. Upon further investigation, I determined that one autonomous system (AS) in particular tended to announce very large networks it did not own. Figure 1 was created with no filter and this AS data skewed the results. Therefore, the counts were redone with the misbehaving networks removed from the computation. The result was Figure 2.
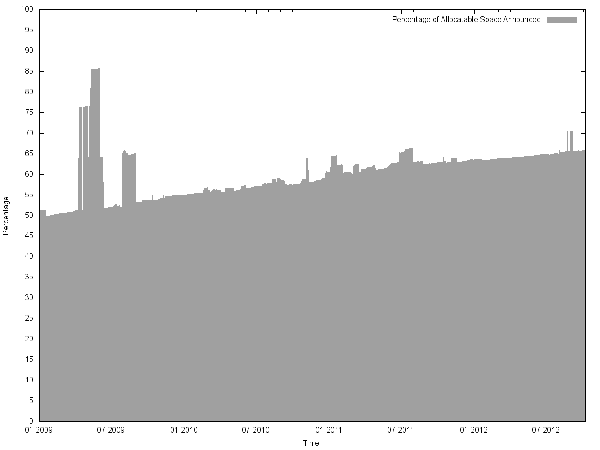
There was still quite a bit of churn displayed in Figure 2, represented by minor spikes and plateaus. Therefore, I examined the results, in particular during the dates of the spikes. Several AS data sources were discovered to be announcing networks they should not have announced. While not as egregious as the first AS, the additional announcements were removed. Thus, the more accurate Figure 3 resulted. Note the change in vertical scale.
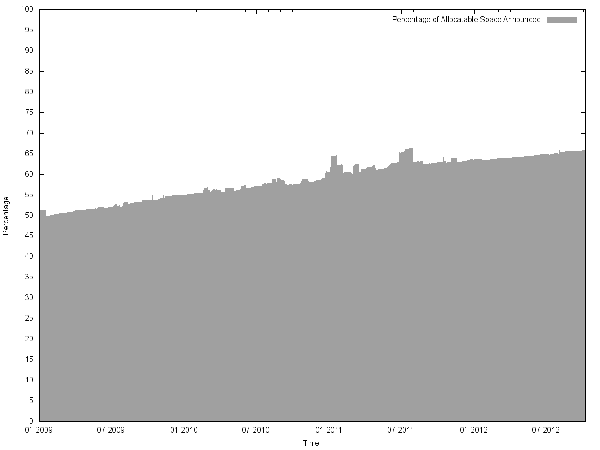
While not a perfect view, Figure 3 demonstrates the gradual growth of the announced IP space versus the space available to be announced since January 1, 2009 through the end of 2012.
This analysis demonstrates that advertised address space grows at an average of 6.7% per year. The data fit a line to it with a slope of 0.0116 and an intercept of 50.62 with a RSS of 0.977.
More By The Author
More In CERT/CC Vulnerabilities
PUBLISHED IN
Get updates on our latest work.
Sign up to have the latest post sent to your inbox weekly.
Subscribe Get our RSS feedMore In CERT/CC Vulnerabilities
Get updates on our latest work.
Each week, our researchers write about the latest in software engineering, cybersecurity and artificial intelligence. Sign up to get the latest post sent to your inbox the day it's published.
Subscribe Get our RSS feed