Software Cost Estimation Explained

Have you done any remodeling work on your property or built a house from scratch? The first step is usually to figure out what remodeling work you need or what kind of house you want, which is constrained by your budget or the amount of money you are willing to spend. Developing software follows a similar process. In this SEI Blog post, I discuss how software cost estimation works and why we need cost estimates. I also present some estimation tools and examine the inherent biases that exist in software cost estimation models and tools and ways to get around them.
(It is important to note that this blog post is focusing on the estimating the effort and cost of developing software. Items required to support a software system [i.e., components, external services, supporting hardware, etc.] are not accounted for in software development estimates and are not considered in this blog post.)
Estimation Analogy
Let’s say you want to put new flooring in your house. At first, you may start to look at flooring options and consider whether you want to put in hardwood, tile, or carpet based on the needs of the flooring space. You may start to get estimates from contractors. In so doing, you realize that the flooring job cost estimate is a function of the square footage and may look something like this (note, this is a simplified example):
In this equation, α is the square footage area of the new flooring space. The square footage of the area is the size metric of the job and a major determiner of the cost. The floor unit price, labor unit price, and additional material are cost drivers, which change the cost based on your choices (expensive versus affordable options). While the area of space that needs new flooring can’t necessarily be changed (unless you decide to break up the project into smaller portions), you may select a range of floor unit prices that would fit within your budget or what you feel comfortable spending.
This analogy demonstrates that a simple estimation model needs the following components:
- a size metric
- cost drivers
- the mathematical relationship among size, drivers, and cost
The Need for Software Estimates
Unless we have unlimited amounts of money, the first need for an estimate is to determine whether we can afford the software product or how to adjust the scope to balance needs and wants with budget. Return on investment (ROI) analysis helps identify a profitable balance between money and time spent developing the product versus the expected benefits. (Note, in most cases, quantitatively measuring attributes relevant in an ROI analysis can be difficult. For example, measuring the benefits of making code secure. Secure coding is a preventative action, and the consequences of code vulnerabilities are difficult to predict and measure.) Estimates help manage and plan required resources, such as personnel, equipment, and tools. Dependable estimates help manage expectations among stakeholders of the project and ensure sufficient time and resources are provided for high-quality work.
Software Estimation Components
Size Metric
In cost estimation models, the size metric is a major indicator of the amount of the work to be accomplished and, therefore, a major determiner of the cost. In the flooring analogy, the size metric is obvious: It’s the square footage of the area requiring new flooring. But how do we size software? Software doesn’t have physical dimensions. The closest approximation we have to a physical dimension is the code. Hence, historically, source lines of code (SLOC) (the count or estimate of the number of lines of code needed) was the first size metric identified and used for software cost estimation.
Cost Drivers
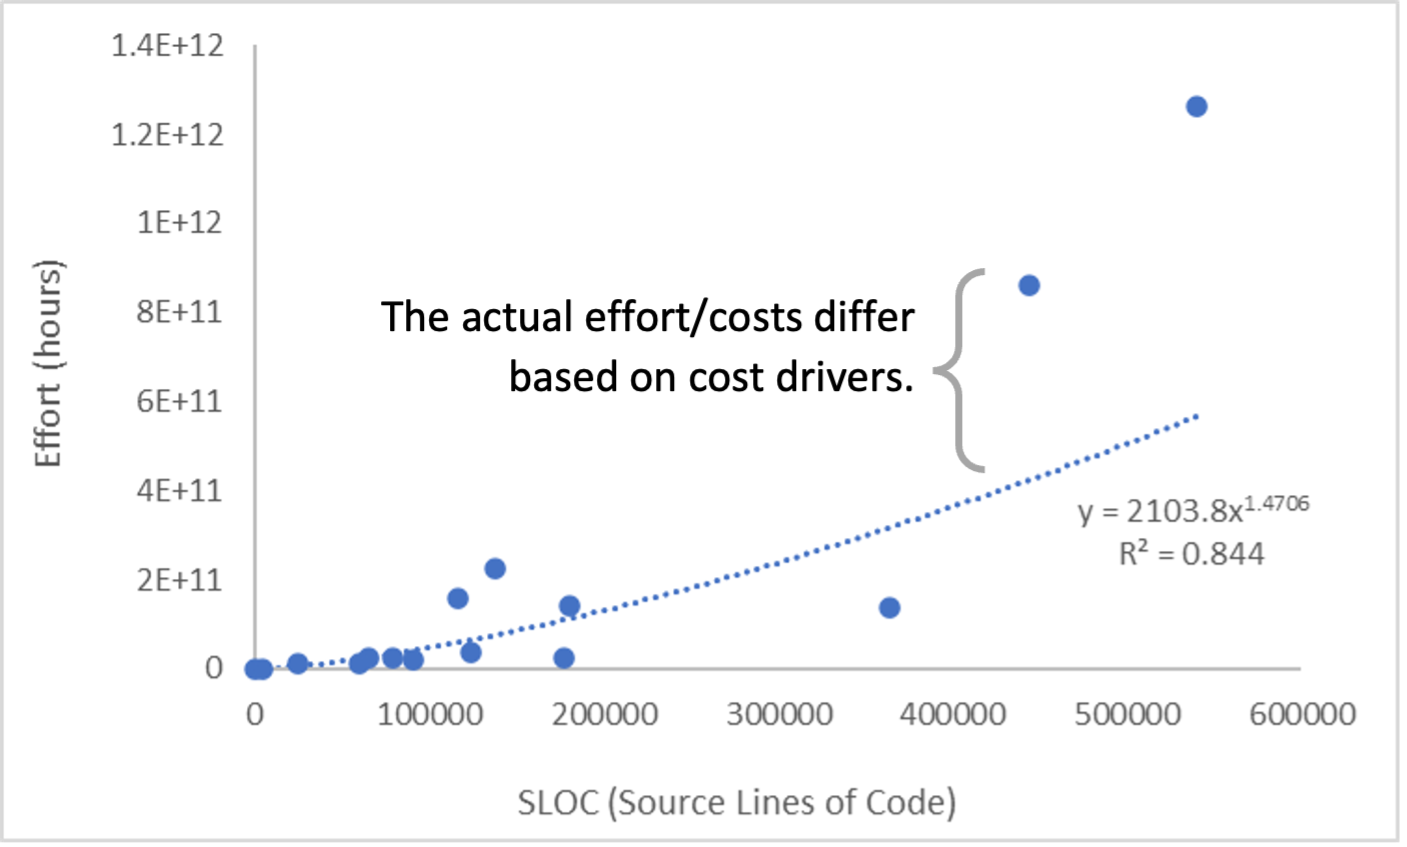
Do we need both size and cost drivers? What are cost drivers and how do they differ from size? While size provides an average effort or cost, the actual effort or cost must be adjusted to consider positive and negative factors. For example, more experienced coders would be able to write more code in less time compared to less experienced coders. Hence, the effort for more experienced coders would be lower than for less experienced coders. Figure 1 visually demonstrates how size and cost drivers work together to provide more accurate effort estimates. Cost drivers fall into the following categories with some examples:
- product (e.g., reliability requirements and time constraints)
- process (e.g., early risk identification and resolution and amount of documentation being produced)
- personnel (e.g., experience and processes used)
- environment (e.g., team co-location and tools usage)
Mathematical Relationship
Generally, software cost/effort estimation models use a power equation:
This equation form accounts for the fact that effort grows at a nonlinear rate relative to size, while cost drivers have a multiplicative effect on effort/cost (moving the effort or cost up or down from the average).
A Sample of Software Cost Estimation Tools
I briefly describe generalizable software cost estimation models/tools that publicly provide information on the underlying data and mathematics used. Generalizable models are built on data collected across several organizations and various application domains, which are useful when organizations do not have data to develop their own models, and/or their data does not accurately describe the type of application they need to build.
Constructive Cost Model (COCOMO) II
COCOMO (Constructive Cost Model) II is a parametric software development effort estimation model that requires size, personnel, product, and environmental attributes as input and returns the estimated effort in person-months (PM) as the output. This cost model is calibrated with 16 organizations’ data. The form of the COCOMO II model is:
Size is represented in terms of KSLOC, or 1,000 SLOC. EM stands for effort multipliers, and SF stands for scale factors. While both effort multipliers and scale factors are cost drivers, they differ in their effects on effort. Effort multipliers have a multiplicative (linear) effect on effort, while scale factors affect the exponent (and thus affect the effort nonlinearly). The ratings of the five scale factors can set the exponent between 0.91 and 1.23, while the default is 1.0997. A is the calibrated productivity constant, while B and C are calibrated exponent constants (as noted by Boehm et al. in Software Cost Estimation with COCOMO II). The COCOMO II model is open and fully specified in Software Cost Estimation with COCOMO II, which allows for organizations to calibrate the constants or even the cost drivers to better represent their software development environment.
SEER-SEM by Galorath
SEER for Software (SEER-SEM) from Galorath is a proprietary software cost estimation model that allows SLOC and function points as size inputs and cost drivers (such as platform application and complexity) to get the effort estimate:
Lx represents the effort units, which are based on the analysis of actual project data. AdjFactor is the product of complexity and cost driver adjustments. Entropy ranges from 1.04 to 1.2, depending on the type of software being estimated. SEER-SEM’s data repository consists of thousands of data points that come from Department of Defense (DoD) projects and commercial software products.
TruePlanning by Unison Software
The TruePlanning software model is Unison Software’s proprietary software estimation model. It uses activities, resources, programming languages, size, and cost drivers as inputs. Data has been gathered across various domains: business systems, military, avionics, flight and space software, and commercial software. The model estimates effort using the following formula:
Baseline productivity varies by activity and size metric used. It is calculated using existing data and/or research results to determine this productivity rate. Productivity adjustments are the numerical effects of cost drivers on productivity. Size can be represented in terms of SLOC, function points, predictive object points, or use case conversion points.
Summary of Cost Estimation Tools
The software cost estimation tools follow the foundational concepts explained earlier: They use one or more size metrics, identify several cost drivers, and use a mathematical equation relating both size and cost drivers to estimate effort. Additionally, these tools use data from various application domains and organizations for generalizability.
While generalization is a useful property for an estimation model, in cost estimation practice this generalization has a drawback. The estimated effort, or cost, is computed with data from multiple organizations and application domains. The developers of COCOMO II, SEER-SEM, and TruePlanning must keep their data sources confidential to ensure that organizations continue to provide such data for future updates to the models. Hence, limited details are known about the projects underlying these cost estimation models, making it difficult to assess how applicable or accurate the models will be for a specific environment and project.
A common aphorism in statistics is all models are wrong, but some are useful.
Models, by nature, are approximations of reality. Depending on how accurate the mathematical assumptions are, some models are better than others at being useful in predicting. In the next section, I will provide some strategies on how to make generalizable cost estimation models more useful.
Inherent Biases and Possible Solutions in Software Cost Estimation
Data Varies across Organizations and Teams
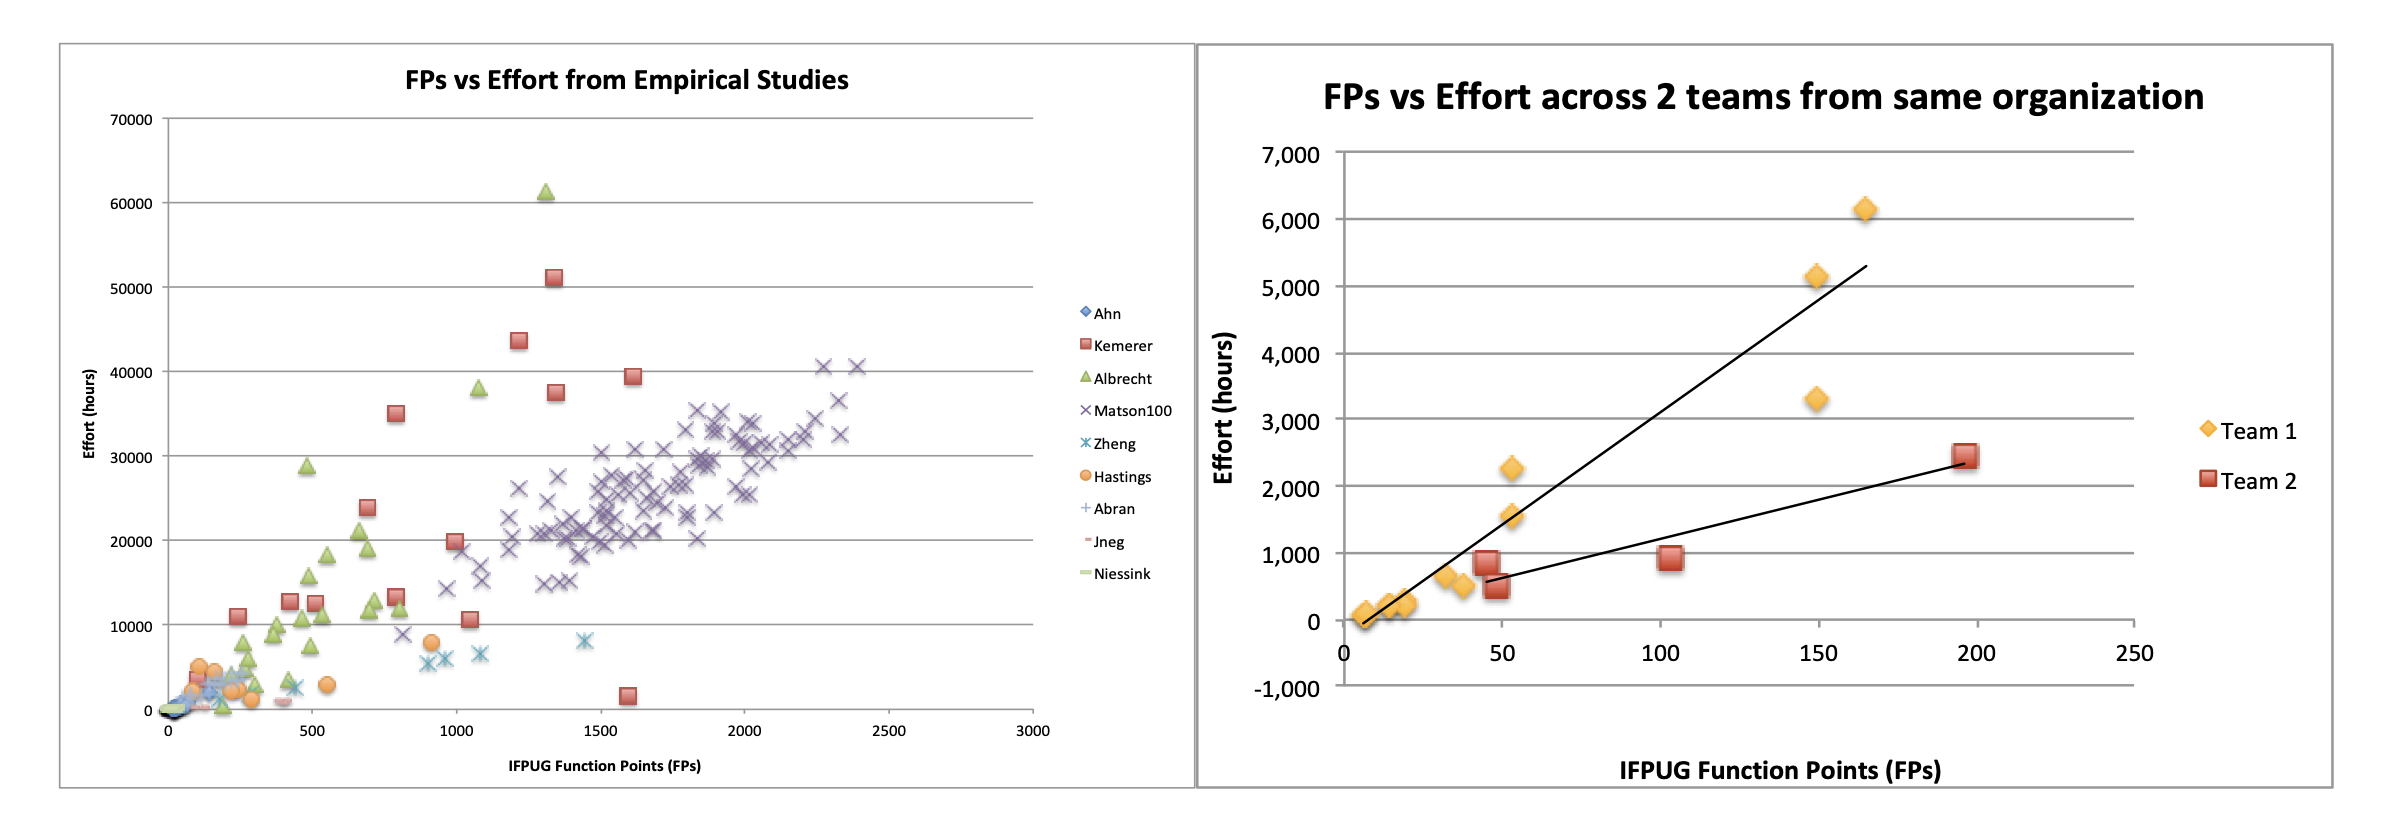
The two graphs in Figure 2 below show how the trends between size, in terms of function points as defined by the International Function Points User Group (IPFUG) and effort, which can differ across organizations (left) and across different teams from a single organization (right). Figure 2 demonstrates that the software development trends (and specifically the effort/function point ratio) can be quite different across different software types and development environments, even within the same organization and team. Software cost estimators have noticed similar trends with SLOC, too (software development trends differ across organizations and even teams). It’s worth noting that Wikipedia provides a high-level overview of how to calculate function points.
Cost drivers help explain some of the variations across the data, normalizing the differences in development environments and application types, leading to more accurate effort or cost estimates. Additionally, organizations and teams can calibrate an existing cost model to their data to further improve the estimation accuracy. Since COCOMO II is an open model, an organization or team can easily calibrate it to better fit their own data and development environment.
New Project Not Represented in the Model
The projects represented in the data underlying cost estimation models determine what the models can estimate with some amount of certainty. While new projects may be similar to existing or previous projects, there will be at least some new functionality. The new project might be much larger in scale while having similar functionality to a project represented in the model. Or, it might have components with different functionality that is still represented in the model. Or, it might be innovative and employ new technology that is not represented in the model. Or, the new project will use a different architecture and/or serve different purposes/uses. Therefore, despite how generalizable cost estimation models are, a new project might not be well represented in the data that underlies a given cost estimation model (due to small statistical samples available in the underlying data). Even if the model represents a new project well, architecture decisions or changes in the implementation increase uncertainty for at least some parts of a project.
Cost drivers can be adjusted to better represent the differences of the new project. For example, if the new project has a component with new functionality that matches the description of a higher level of the complexity parameter, this cost driver rating change will help normalize the differences of the new project. If there is data that better represents the new project, estimators can use it to calibrate the cost model. Finally, estimators should perform uncertainty and risk analysis and also document and communicate the uncertainty and risk in the cost estimate.
Requirements Uncertainty and Volatility
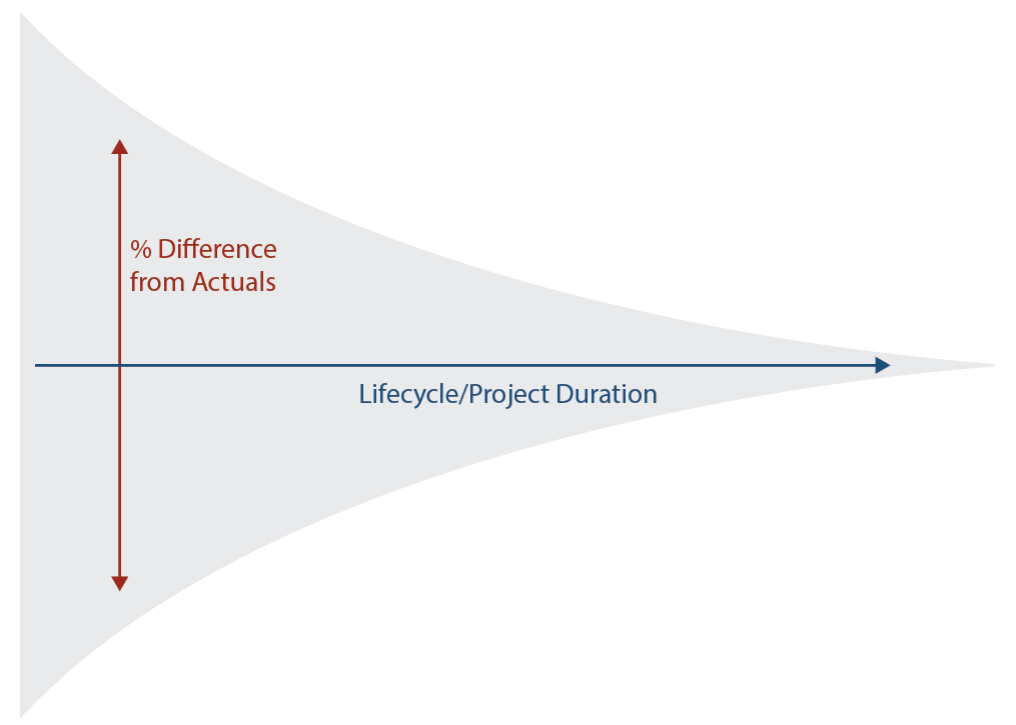
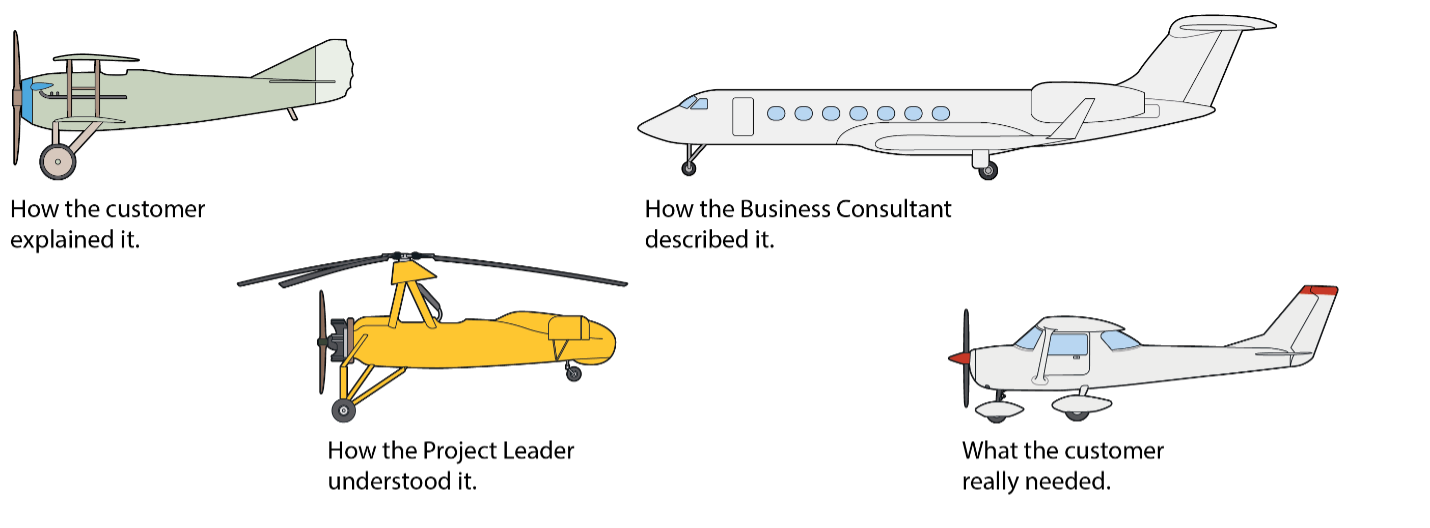
Estimates are based on the approximated size of the requirements—a representation of what will be developed. It is very common for requirements to change through the lifecycle, as customers and users start to better understand how the system needs to work or as the technology or the environment around the system changes. As the requirements and specifications for the required software project change, so should the size estimate. (Figure 3 illustrates how uncertainty and consequential error in estimates reduce over a project’s lifecycle.) Additionally, various stakeholders may interpret the needs and requirements differently (see Figure 4), causing uncertainty and volatility in the requirements and lowering the accuracy of the size estimates, especially early in the lifecycle. Incremental and Agile software development lifecycle models attempt to address this. These models accept and expect requirements change over the lifecycle and have stages where the requirements are re-evaluated.
How do estimators account for requirements uncertainty and volatility in the cost estimate? The first step is to include an uncertainty and risk analysis based on the maturity of the requirements or current progress in the software lifecycle. Additionally, estimators can look at past data, get subject matter expert input, or get team insight on the volatility factor—a multiplier applied to the size to account for rework caused by changing requirements. For example, if past data suggests that requirements volatility caused about 25 percent rework, estimators can apply a 1.25 factor on the size to account for the rework in the estimate. Finally, effort and cost estimates should be updated as the requirements change or are interpreted in a way that leads to changes in the size estimate. This ensures that the cost estimates accurately represent the current understanding of the project’s scope.
Additional Topics in Software Cost Estimation
This blog post went over the basics of software cost estimation: the components needed to build a cost model, a few existing cost estimation models, and some biases with using generalizable cost models and how to overcome them. The intent of this post is to provide readers with a high-level understanding of how to use generalizable software cost estimation models and some insight on how they generate estimates. In future SEI Blog posts, I will discuss the various existing software size metrics, their uses and benefits, the differences between commercial and government lifecycles and their estimation needs, and other cost-estimation topics.
Additional Resources
Read the dissertation Calibrating COCOMO® for Functional Size Metrics.
Learn about other SEI research on cost estimation.
Written By

Get updates on our latest work.
Sign up to have the latest post sent to your inbox weekly.
Subscribe Get our RSS feedGet updates on our latest work.
Each week, our researchers write about the latest in software engineering, cybersecurity and artificial intelligence. Sign up to get the latest post sent to your inbox the day it's published.
Subscribe Get our RSS feed