Second Level Domain Usage in 2012 for Common Top Level Domains
Hi, this is Leigh Metcalf with my colleague Jonathan Spring. Here is a look at second level domain (SLD) usage in 2012 for the most common generic Top Level Domains (gTLDs): biz, com, info, mobi, net, and org. We used two data sources: (1)the master zone files (RFC 1035 sec. 5) and (2) the SIE (http://sie.isc.org), a passive DNS data source. From these sources we examined three features of global gTLD usage--the number registered, the number active, and the ratio.
Table 1 shows stats about domains registered in 2012 from zone file analysis. Start and End are the number of SLDs in each zone file at the start and end of 2012, respectively. Max is the largest number of unique SLDs in the zone file we observed on a day throughout the year.
| TLD | Start | End | Average | Date of Max | Max |
|---|---|---|---|---|---|
| biz | 2,175,697 | 2,276,104 | 2,240,193.5 | 2012-11-15 | 2,281,118 |
| com | 99,303,617 | 106,876,588 | 103,329,433.9 | 2012-12-31 | 106,876,588 |
| info | 8,221,272 | 7,047,407 | 7,743,564.8 | 2012-01-31 | 8,269,131 |
| mobi | 1,011,381 | 1,041,155 | 1,033,351.4 | 2012-04-13 | 1,046,251 |
| net | 14,363,672 | 14,965,672 | 14,721,459.3 | 2012-12-31 | 14,965,672 |
| org | 9,666,025 | 10,166,747 | 9,983,061.1 | 2012-12-31 | 10,166,474 |
The com, net, and org domains all increased through the year. The biz and mobi domains also showed gains, but not consistently. The info TLD consistently shrunk. However, just because a domain is in a zone file doesn't mean that anyone is actually using it. To determine level of use, we looked at what domains were resolved; for this analysis, we turned to the SIE and measurements of unique active domains per day (0000-2359 UTC) during 2012.
From the SIE database we considered the average number of unique second-level domains resolved per day and the growth rate through the year (see Table 2). This value is bounded by the zone file contents since only domains in the zone file can be resolved; but the value is also is heavily influenced by other factors.
| TLD | Start | End | Average | Growth Rate |
|---|---|---|---|---|
| biz | 80,167 | 71,257 | 93,451.8 | -11.1% |
| com | 10,284,693 | 9,287,419 | 10,990,617 | -9.7% |
| info | 326,843 | 206,897 | 283,529.1 | -36.7% |
| mobi | 8,202 | 8,858 | 10,358.8 | 8% |
| net | 7,763,538 | 998,950 | 1,198,016.8 | -14.2% |
| org | 1,041,970 | 941,262 | 1,130,457.8 | -9.7% |
Despite of the growth in zone file size, the number of unique SLDs resolved per day decreased. There are spikes in the number, some of which can be attributed to measurement volatility; however, the general trend downward does not seem to be due to measurement error. Especially in the case of the info domain, it is interesting to ask if the large changes in zone file size effected the percentage of domains from the zone that were resolved per day. Figure 1 displays the percentage of domains in the gTLD zone files that were resolved every day during 2012.
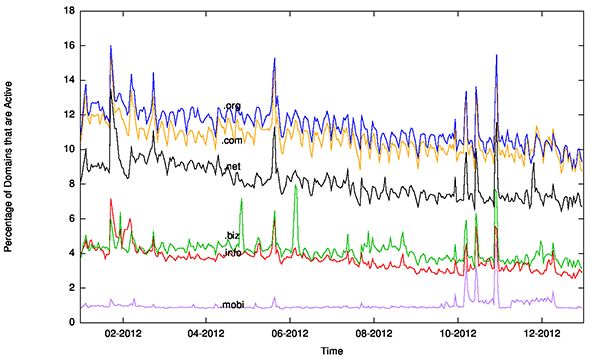
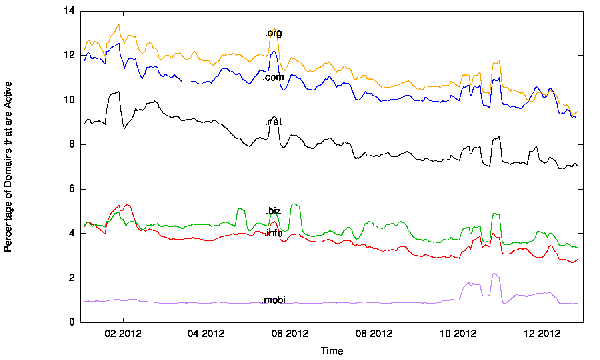
These lines are not smooth, due to both natural weekly and daily usage cycles and some other more curious spikes. Using time series analysis, we examined the underlying trend and extracted these cyclical patterns and one-time spikes. Figure 2 illustrates the trend without these factors. Note that the Y axis scale changes from 0-18% to 0-14%. The trend is distinctly downward, with the exception of the mobi domain, which remains approximately constant.
As you can see, despite the increase in the number of domains that are registered in the official registries, the number of SLDs that are active each day has decreased during the course of the year, both in absolute terms and as a percentage of the domains in the zone file. We have not yet determined a causal explanation for this phenomenon, so comments are welcome. Send your comments to netsa-contact@cert.org.
More By The Authors
CERT/CC Comments on Standards and Guidelines to Enhance Software Supply Chain Security
• By Jonathan Spring
More In CERT/CC Vulnerabilities
PUBLISHED IN
Get updates on our latest work.
Sign up to have the latest post sent to your inbox weekly.
Subscribe Get our RSS feedMore In CERT/CC Vulnerabilities
Get updates on our latest work.
Each week, our researchers write about the latest in software engineering, cybersecurity and artificial intelligence. Sign up to get the latest post sent to your inbox the day it's published.
Subscribe Get our RSS feed