Security Analytics: Tracking Software Updates

To put network operations in context, analysts need to track the software running on the organization’s network. This tracking involves not only keeping tabs on which applications are running, but whether those applications are being regularly updated in versions and patches. Many security checklists recommend keeping software current on applicable recent versions and patches. Such recommendations, including RFC 2196, under “ongoing activities,” have been in place for decades. DHS/CISA recommendations on defending against current ransomware threats emphasize keeping your computer patches up to date. Some organizations push updates onto internal clients and servers, but others use vendor-supported update services. This blog post presents an analytic for tracking software updates from official vendor locations.
There are a number of ways that tracking updates helps to inform network security efforts. Using vendor-supported update services may require clients and servers to poll designated download sites for the most current updates. By knowing which hosts are receiving updates, analysts can track compliance with the organization’s update policies. Tracking which updates the clients and servers are receiving also helps confirm the software configuration on those devices, which in turn may feed into the network vulnerability management process. Finally, tracking the dates at which updates occur helps to identify how current the configured software is on the organization’s clients and servers, which may give a sense for which vulnerabilities may be of concern in protecting the network.
After we know why to track updates, analysts can determine what information is desired from the tracking. This blog post assumes analysts want to track expected updates to software, as part of managing and security the network. Knowing the update server, whether it was polled or downloaded to which client or server, and at what time the contact was made to the update server all provide a useful basis for this network management effort. For other purposes, alternate information may be required (e.g., if analysts need to track the bandwidth consumed by the update process, then knowing duration and byte volume of the contacts with the update server would be important). The analytic discussed below is specifically to identify which internal hosts are receiving updates from which source and over what time period.
Overview of the Analytic for Tracking Software Updates
The analytic covered in this blog posting assumes that the update locations are known by the analysts. Common URLs for update locations include:
- Microsoft (https://social.technet.microsoft.com/Forums/en-US/b3327a8c-88e0-4b7e-a1be-446498f726d8/list-of-update-server-addresses?forum=winserverwsus)
- Apple (https://support.apple.com/en-us/HT210060 under “software updates”)
- Apache (https://downloads.apache.org/)
- Google (https://dl.google.com)
- Mozilla (https://download-installer-origin.cdn.mozilla.net)
- Oracle (https://download.oracle.com)
Analysts may build a more site-specific list through discussion with the network administrators as to which update locations are allowed through firewalls and other defenses.
The approach taken in this analytic is to use the list of update locations and identify transfers of data into the internal network associated with those locations. The list of URLs may require conversion by isolating the host portion of it and resolving the IP addresses involved. These addresses can then be encapsulated as a text file, an IP set file, or as an SQL table, depending on the tooling involved. The output of this analytic is a list of internal addresses and a summary of the contacts by the update sites.
Several different tools can be used to track software updates. Packet capture and analysis could be used, but often the volume of data and the focus on packet detail make it time consuming to aggregate and extract the information to produce the summary. Intrusion detection system (IDS) rules, either for host or network-based IDS, could be established to issue an alert each time an update is made, but such alerts are often hard to federate across a medium or large-size network infrastructure and require filtering and post-processing to provide the summary information.
Logs, either from clients, servers, or security devices, such as firewalls, could contain records of update contacts. Again, however, a time-consuming process would be needed to filter, federate, and aggregate the logs before processing them to identify the summary information. This blog describes use of network flow records (which summarize network connections) and applying them in a retrospective analysis (via the SiLK tool suite), streaming analysis (via Analysis Pipeline), and through an SQL database.
Implementing the Analytic via SiLK
Figure 1 presents a series of SiLK commands (SEI’s suite of tools that retrospectively analyze traffic expressed as network flow records) to implement an analytic that tracks software updates. The rwfilter call isolates traffic inbound on known web ports (80, 8080, or 443) to the monitored network from one of the identified update IP addresses, considering only flows representing more than a protocol handshake (i.e., those with three packets or more: two for the protocol handshake and at least one to transfer data). The rwuniq call produces a summary for each destination (internal) address showing the timing of the traffic. The call to head abbreviates the output for this blog and would not be included for production use.
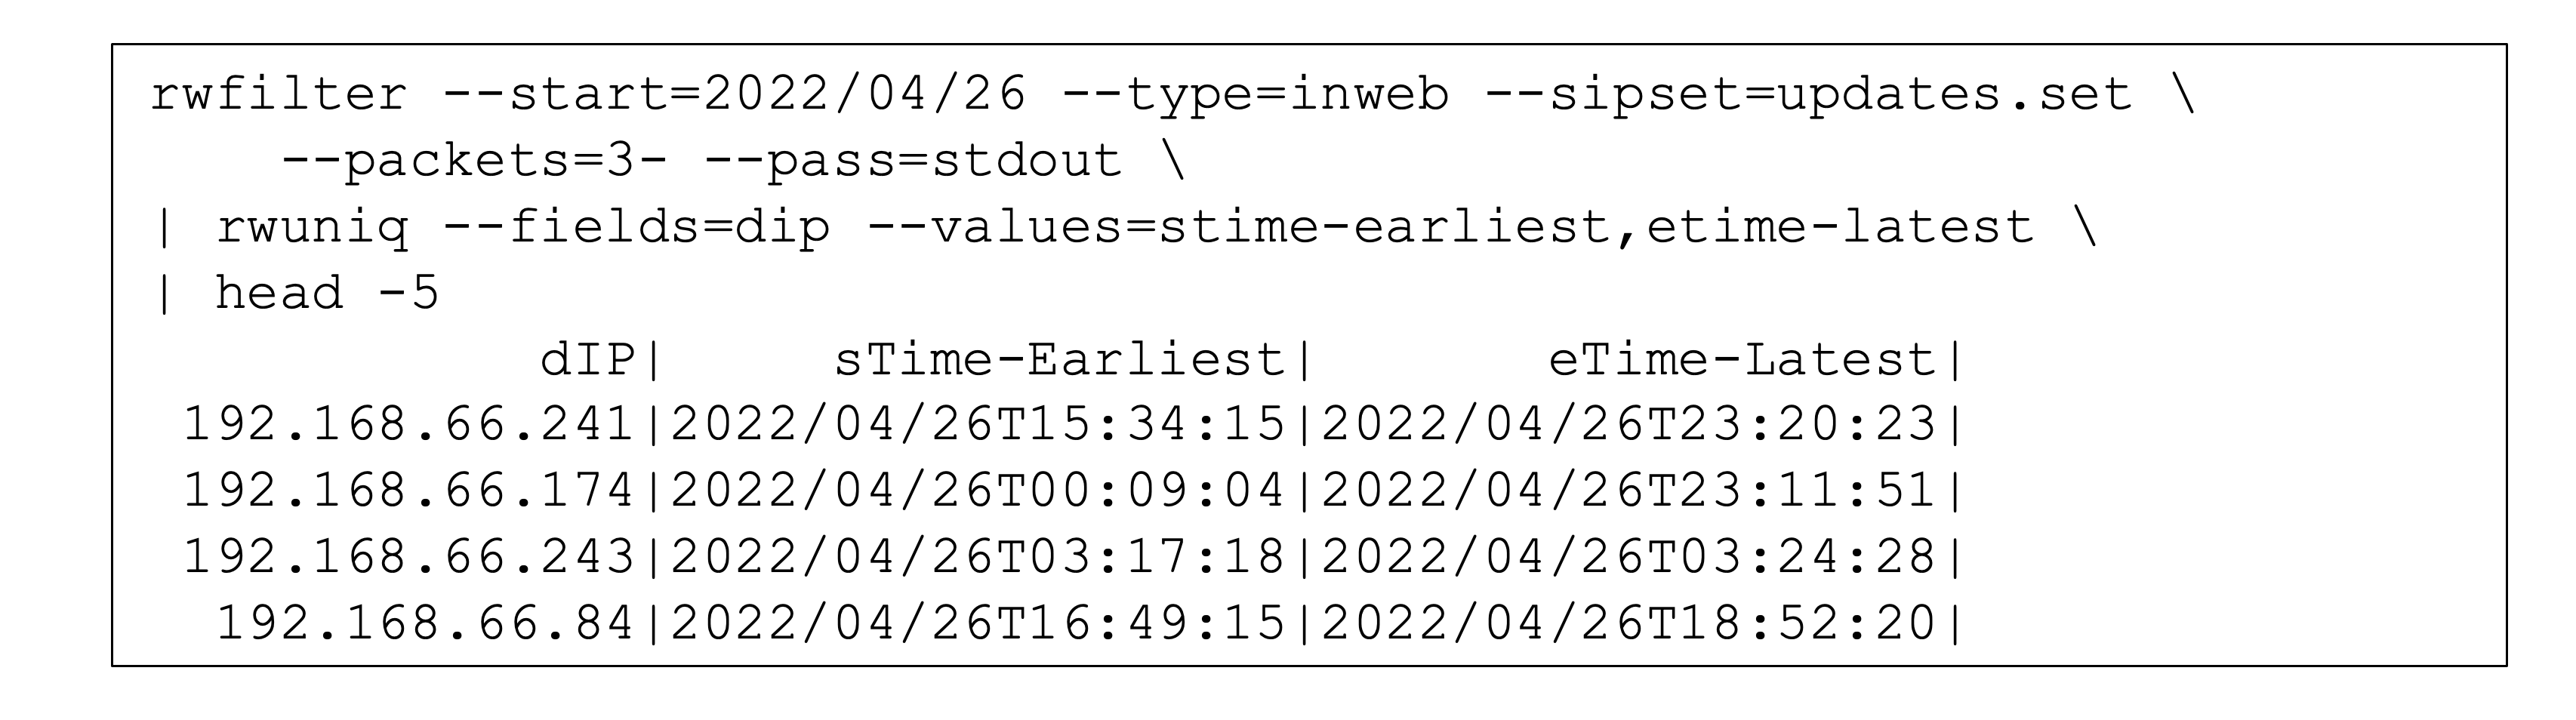
The results in Figure 1 show four internal hosts being contacted (only four, due to head’s trimming of output). Of these four, the first two show contacts over more than six hours, which is common for repeated polling for updates during a workday. The latter two show contacts over comparatively brief periods of time (7 minutes and 2 hours, respectively), which would require more investigation to determine if these assets were only connected briefly or if the contacts identified are not actually update traffic. Since this analytic uses solely IP address and traffic type, false positives (i.e., traffic being classified as updates when in truth it is not) may be expected to occur occasionally. One method of dealing with the false positives would be adding an rwfilter call after the initial one, which would use a variety of characteristics to exclude the falsely identified records.
Implementing the Analytic via Analysis Pipeline
Figure 2 shows the analytic implemented as a configuration for Analysis Pipeline. In contrast to the SiLK version described above, the pipeline analytic identifies update servers using hostnames, transport protocols, and ports, rather than IP addresses. There are separate lists of hostnames for HTTP and HTTPS update servers. Since the hostnames from the update documentation contain wildcards, these lists must be structured to match the domains, as well as hosts.
Analysis Pipeline supports this capability by adding a header line in each list that flags it as being in DNS format (##format:dns). The first filter, httpHostDetectUpdate_filter, uses the list for HTTP servers and matches them against the deep packet inspection (DPI)-derived hostname parsed from the HTTP traffic, using the extended flow fields that are populated by YAF. This filter only considers (1) records from one of the servers to the monitored network’s internal addresses and (2) traffic to the common web transport port (TCP/80) with three packets or more (again, excluding traffic consisting only of protocol overhead).
The second filter, sslServerDetectUpdate_filter, follows a similar process but uses the sslServerName matched against the HTTPS server list and the HTTPS common port (TCP/443). The output of these two filters is combined in the third filter, updateDetect_filter, which in turn is invoked by the internal filter, updateDetect_intfilter, to construct a daily list of addresses on the monitored network that have contacts from the update servers. This list is reported to a file by the list configuration, updateDetect_list. Analysis Pipeline produces only this set file as an output, so no display is shown in Figure 2.

Implementing the Analytic via SQL
Figure 3 provides an implementation of the analytic in SQL-like notation. This notional example assumes that IPFIX (an Internet-standard flow record format described in RFC7011) information elements are present in a table of records, referred to as flowData, and that the list of known update hosts is present in a separate table referred to as updateTable and having IP address and port information in that table. The inner SELECT isolates relevant information elements for records where the source address matches an update server, and the port and protocol also match, considering only records for flows aggregating more than three packets. The outer SELECT statement produces a summary similar to the output of the SiLK analytic in Figure 1.

Understanding Software Changes
Whichever form of tooling is used, analysts often need an understanding of the software changes to their networks, even the expected ones. The analytic presented in this blog posting provides a first step at this understanding, although over time analysts should revise and specialize it to reflect their needs. Several of the following potential causes may need further investigation if the observed updates lack many of the expected ones:
- There has been a change in the update servers, and the list used in tracking must be updated. (Hint: see if other internal assets are being updated from the server in question)
- There has been a change in the internal host: either taken out of service or had its software reconfigured. (Hint: see what other activity is present for the internal host)
- The internal host’s administrator or an attacker has disabled the update service, which is usually contrary to security policy. (Hint: contact the authorized administrator for the internal host)
- There is a network connectivity issue with respect to the internal host or the update server. (Hint: validate the connectivity involved)
- Other factors have interfered with the update process.
The impact of these causes on the network security will vary depending on the range of assets affected and the criticality of those assets, but some of the causes may demand immediate response.
Additional Resources
Read my earlier blog post in this series “Security Analytics: Tracking Proxy Bypass,” which explores how to track the amount of network traffic that is evading security proxies.
Read the analyst’s handbook for SiLK version 3.15.0 and later, Network Traffic Analysis with SiLK, which provides more than 100 worked examples, mostly derived from analytics.
Read the CERT NetSA Security Suite Analysis Pipeline webpage, which provides several worked examples of analytics.
Read the blog post, “Identifying bot traffic with SQL” by Brittany Davis, a great discussion of using and tuning SQL queries to analyze page traffic to a web server.
Written By

More By The Author
Security Analytics: Using SiLK and Mothra to Identify Data Exfiltration via the Domain Name Service
• By Timothy J. Shimeall
More In Cybersecurity Engineering
PUBLISHED IN
Get updates on our latest work.
Sign up to have the latest post sent to your inbox weekly.
Subscribe Get our RSS feedMore In Cybersecurity Engineering
Get updates on our latest work.
Each week, our researchers write about the latest in software engineering, cybersecurity and artificial intelligence. Sign up to get the latest post sent to your inbox the day it's published.
Subscribe Get our RSS feed